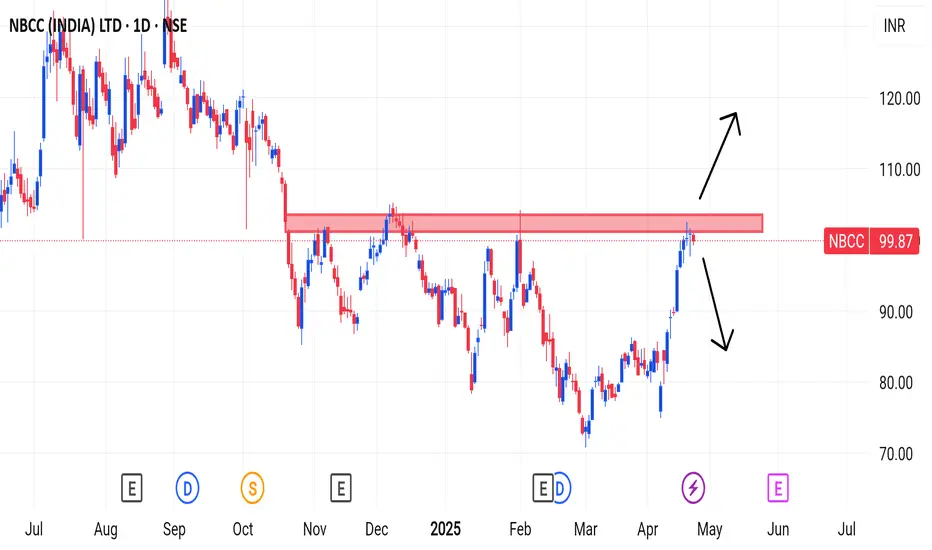
NBCCAn uptrend can be expected above the resistance level.
If it comes back below the resistance level the selling is expected to continue
If you find this helpful and want more FREE forecasts in TradingView, Hit the 'BOOST' button
Drop some feedback in the comments below! (e.g., What did you find most useful?
How can we improve?)
Your support is appreciated!
Now, it's your turn!
Be sure to leave a comment; let us know how you see this opportunity and forecast.
Have a successful week
DISCLAIMER: I am NOT a SEBI registered advisor or a financial adviser. All the views are for educational purpose only
Nbcclong
NBCC forming CUP patternNBCC has formed a CUP chart pattern and traded near neckline level 146.
The volume is increasing as the price is nearing the neckline level. It tried to break the neckline before, but it was a fake breakout or was not sustained.
The monthly RSI is over 78, the weekly RSI is almost 64, taking support at 60, and the daily RSI crosses 60 from below.
If you measure the depth of the cup and clone it over the neckline, that would be your target, and the previous higher low would be your stop loss. If the trade goes as described, it would give you a risk-to-reward ratio over 3.

NBCC Mid Term Idea - 100% ROI Potential with RR of 1:3NBCC - Poised for a good up move.
1) Monthly has taken a proper support at the previous bottom range of 16 Rs and consolidating for about 2 years in Hl formation, it is about to move into an uptrend making a Higher high, breaking the previous high of 59.
2) Weekly is an uptrend, breaking a 6 months old resistance of 44 range.
Major trendlines and support and resistance zones are marked for Resistances which are probable sell zones (TARGETS) and SL.
Will be taking a very strong bullish stance on NBCC with huge upside potential once after monthly closes above 59 range. Yet bullish for a 10% up move in the very short term and 20% till 59, as of now as it has crossed a 6 months old resistance price.
Please comment for suggestions and view points.


NBCC - Ichimoku BreakoutStock Name - NBCC (india) Limited
Ichimoku Cloud Setup :
1). Today's close is above the Conversion Line
2). Future Kumo is Turning Bullish
3). Chikou span is slanting upwards
All these parameters are showing bullishness at Current Market Price
and more bullishness AFTER crossing 77
#This is not Buy and Sell recommendation to any one. This is for education purpose and a helping hand to learn trading in Market.
#CloudTrading
#IchimokuCloud
#IchimokuFollowers
#Ichimokuexpert
I hope you all like my analysis.
Please do share your thoughts into comment section.
Please give a like, share & subscribe for daily analysis.
