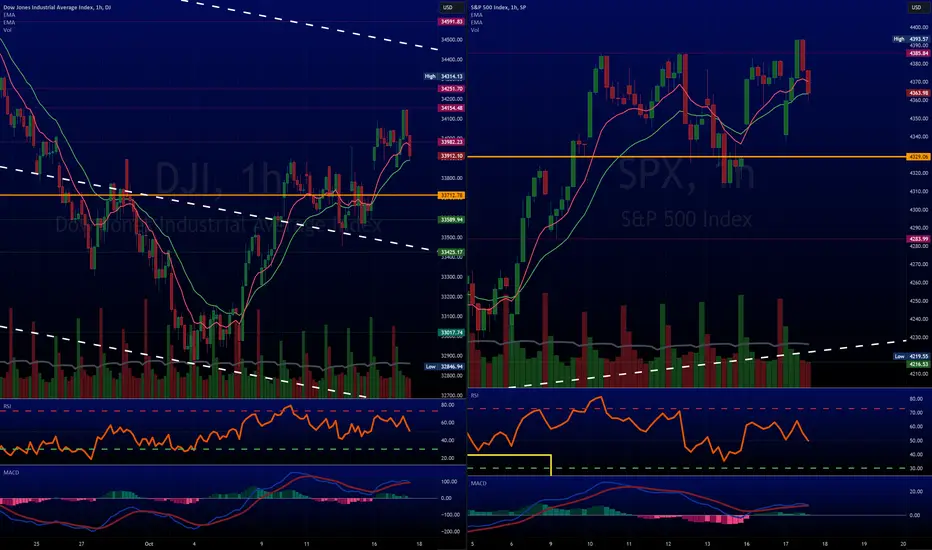
We stopped being bull late Sept $DJI $SPX $NDXInverse Head & Shoulder Pattern on TVC:DJI is dissipating FAST.
(This pattern helps with bottoms)
🚨🚨🚨
It is GONE for CBOE:SPX , in fact, DANGER!!!
TVC:NDQ about to test support again. Could it be a double bottom or will it break through?
AGAIN, we stopped being on the BULL train in late Sept.
RISK is HIGH!!! VERY HIGH!!!
NASDAQ 100 CFD

10Y & 30Y Yield losing more steamGOOD MORNING!
#interestrates look like they want to slow down a bit, short term top.
We see the 10Y & 30Y pulling back a bit...
But this is better seen intraday.
We'll see how that unfolds...
IF IT DOES, it could cause a sharp rise in #Stocks.
Coincidentally, DJ:DJI @ support & TVC:NDQ is near a major support.
TVC:TNX AMEX:DIA NASDAQ:QQQ

QQQ weekly consolidation confirmedQQQ weekly consolidation confirmed
Context:
weekly - downtrend (DT)
daily - uptrend (UT)
Last day:
Price broke previous week low, signaling start of weekly consolidation. Value is overlapping with the previous day.
Conclusion:
Market looks very bearish but there is an interesting nuance. Although weekly consolidation confirmed we're still in daily UT, which is a bit abnormal. Moreover, value has been moving down very reluctantly in the past 4 days. All these might be a sign that bulls are still somewhere undercover waiting for the right moment to kick-in. Important levels to watch is trend line support and last daily pullback low (353). If there are signs of reversal we can then witness a very nice shortcovering rally
Disclaimer
I don't give trading or investing advices, just sharing my thoughts

Nasdaq NQ1!) - LONG ... Then Short!This thing is taking off here, as expected. Load up!
The chart ought to be self explanatory. (March is usually bad for equities, just keep that in mind.)
USD strength is major factor here which should keep a nice strong lid on this, later on.
Here is a closeup;

Citizens Financial Group. Possible Upside on Q3'23 Earnings CallBond pressure...
Pushing' down on me,
Pressing' down on you,
No man ask for...
Technical graph says that possible upside with NYSE:CFG stocks could be possible, with projected/ targeted line at 52W SMA.
With 6.20% dividends yield, double-digit operating yield and P/B just at 0.6, NYSE:CFG securities can be considered as quite undervalued.
The protection level can be considered as multi months (6-, 12-months) low.

#NASDAQ last chance --------------NASDAQ/NDX/USTECH100-------------
Amidst tensions there is one final hope indexes can turn around and continue their route to the upside instead of biting the dust. Now or never I would say. If current support levels don't hold price, nothing will and we will see more downside movement. Based on that I closed my hedge position and if it proves to be true that price cannot fall beyond these levels I would consider to add to long position.
This is not a financial advice, do your own research and analysis.

#NASDAQ to the upside------------NASDAQ/NQ/USTECH100-----------
I just went long on Nasdaq index and looking for further upside movement. From fundamental point of view I can say investors expect no more rate hike this year or in the near future. War news outside the US does not really affects this market. From technicals I can see a higher chance to go upside rather than downside at the moment. Weekly level can be the first target here (blue line).
This is not a financial advice, do your own research and analysis!

NASDAQ: Golden Cross and a Channel Up combined.Nasdaq formed a Golden Cross on the 4H timeframe today while turning bearish on the technical outlook (RSI = 40.347, MACD = 7.500, ADX = 49.160). This means that as it approaches the bottom of the Channel Up, it becomes an oversold buy opportunity. The former bullish wave targeted almost as high as the 2.0 Fibonacci extension. Our target this time is also a little lower (TP = 15,700).
## If you like our free content follow our profile to get more daily ideas. ##
## Comments and likes are greatly appreciated. ##

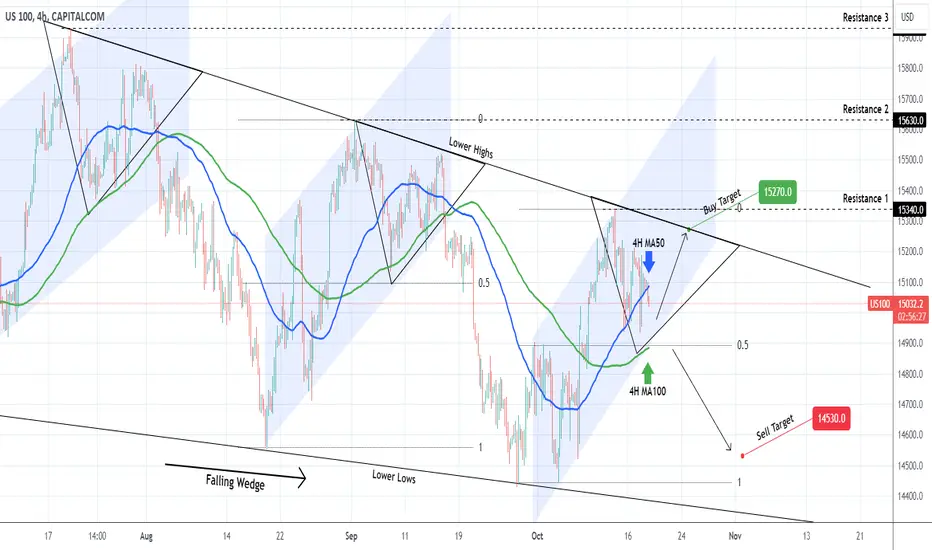
NASDAQ Best action plan for the short-term.Nasdaq (NDX) is trading on the 4H MA50 (blue trend-line), pulling back after a Lower High at the top of the Falling Wedge pattern. The formation that took it that high is a Channel Up which hasn't yet been invalidated. As a result we currently sit on a bullish short-term signal until broken, with a 15270 target (Lower Highs trend-line). If the price closes below the 0.5 Fibonacci retracement level, which would also be below the 4H MA100 (green trend-line), it will be a sell confirmation like that of September 19, and we will sell, targeting 14530.
-------------------------------------------------------------------------------
** Please LIKE 👍, FOLLOW ✅, SHARE 🙌 and COMMENT ✍ if you enjoy this idea! Also share your ideas and charts in the comments section below! This is best way to keep it relevant, support us, keep the content here free and allow the idea to reach as many people as possible. **
-------------------------------------------------------------------------------
💸💸💸💸💸💸
👇 👇 👇 👇 👇 👇
$DJI & $SPX leading, $NDX trails, but $RUT is shining!DJ:DJI is struggling here a bit but it looks okay, so far.
SP:SPX is in the same boat.
TVC:NDQ has been weaker recently but it moved the most out of the indices.
But look at this! TVC:RUT is shinning nicely today!
Looks like it wants to base here & maybe even move higher!
AMEX:DIA AMEX:SPY NASDAQ:QQQ AMEX:IWM #stocks
New week Nasdaq is still highHello everyone, Although the index price lacked positive momentum in recent trading, its general stability within the axes of the ascending channel, based on holding above the main support extending towards 14800.00, in addition to the formation of the 55 moving average for additional support with its position at 14945.00. This contributes to confirming the positive continuity for the upcoming trading.
The above invites us to wait for the price to accumulate positive momentum to enable it to form new ascending waves, thus reiterating the pressure on the obstacle extending towards 15530.00, and by surpassing it, it will succeed in reaching the additional stations, which may start from 15670.00 and 15870.00, respectively.
The general trend expected for today: bullish

Stocks went from pump to dump, what's in store?#stocks went from basing & curling higher to topping and rolling over.
DJ:DJI had 5 green candle days. It turned to 3 red days.
TVC:NDQ bounced nicely but it reversed the hardest and FAST.
CBOE:SPX is in between both indices,
CBOE:VIX had a GOOD day.
WARNING!!! The more it hangs around here the MORE DANGER equities are in.
Have a great week!!!

$NDX - Rising Trend Channel [MID-TERM]💡 Pattern: Cup & Handle
💡 RSI: Neutral
💡 Risk: Medium
✅ Resistance: 15800
✅ Support: 14500
PERFORMANCE
🔴 ST: NEGATIVE
🟢 MT: POSITIVE
🟢 LT: POSITIVE
*ST: Short-term | MT: Mid-term | LT: Long-term
Verify it first and believe later.
WavePoint ❤️

NASDAQ Hit the MA50 (4h). Will it hold?Nasdaq is on a correction leg after being rejected on the Falling Resistance of the Falling Wedge pattern, a little under the 0.786 Fibonacci level as the September 1st Lower High did.
It hit today the MA50 (4h) and that can generate a short term rebound.
Below that, the correction of the Wedge will be extended lower.
Trading Plan:
1. Buy on the current market price.
2. Sell if the price closes a (1d) candle under the 0.382 Fibonacci level (as September 19th).
Targets:
1. 15200 (little over Fibonacci 0.618).
2. 14600 (over Support).
Tips:
1. The Falling Wedge keeps the medium term bearish. We need a crossing over Resistance (1) to restore the long term bullish trend of 2023.
Please like, follow and comment!!
Notes:
Past trading plan:

Why it might make sense to craft a tail hedge now! Say you’re bearish but find yourself confused by the market. You want to partake in the action if things go south, but not 100% certain, what could you do?
First, you could build some conviction by identifying potential reasons why you think the market could dip lower… Then, devise a ‘tail hedge’ to profit if things indeed go south.
Let’s break down these two steps this week.
In our past two articles, we've highlighted a couple of reasons why we lean bearish. You can find them here: S&P500 Vulnerabilities: from Money Supply to Sectoral Imbalanc & Why we’re watching the Bond/Equity Volatility . But as each week unfolds with more drama, let's revisit the market.
The first idea we want to bring up is the rates-equity dislocation.
On the equities front, we observe the following:
The conventional wisdom has long held that low rates are good for stocks. However, with stocks rising while the Fed hikes rates, has this relationship been disrupted? From 2020 to the end of 2021, we clearly observed this classic dynamic. However, from September 2022 onwards, as stocks continued their ascent despite the Fed's rate hikes, a distinct shift became evident. Could this Equity-Rate dislocation be a by-product of the AI hype? Consider Nvidia’s stock price, which seemingly pinpointed the Nasdaq's low point.
Question is… Is the AI hype a strong enough factor to permanently alter this relationship?
In terms of overarching themes, there are generally defined up and down trends. AI ETFs seem to provide a rough gauge of the sector's peaks and troughs. With the previous peak in 2021 happening in the ETFs right before Nvdia peaks, again now we see a similar trend with the ETFs seemingly having peaked while Nvida trades slightly higher still, and we wonder for how long more?
If this signals a pivot for Nvidia, then the Nasdaq, currently buoyed by AI hype, could falter.
Now, turning to rates: What could drive rates higher? A string of robust US economic data regarding jobs and inflation has emerged. Recent figures for CPI, PPI, and NFP all exceeded consensus estimates, suggesting a robust US economy. Such data might embolden the Federal Reserve to maintain its tightening cycle.
One way to interpret robust economic figures is through an economic surprise index, such as the Citi Economic Surprise Index. This metric quantifies the differences between actual economic outcomes and projections. A positive number indicates that the economy is outperforming expectations.
When you overlay the Citi economic surprise index against the 13-week change in 10-year yields, a clear correlation emerges. When the economy outperforms predictions, yields tend to move in tandem.
This increase in yield represents a significant deviation from its nearly 3-decade trend. Broadly speaking, the Nasdaq 100 Index hasn't experienced such a pronounced change in yield trends since its inception.
On Volatility, Erik Norland from CME highlights an intriguing observation: the relationship between the yield curve slope and VIX when viewed from a 2-year average perspective. He suggests that equity volatility and the yield curve follow cyclical patterns, typified by specific periods:
1) Pre-Recession & Recession -Flat yield curve and high volatility
2) Early Recovery – Steep Yield Curve & High Volatility
3) Mid Expansion – Steep Yield Curve and Low Volatility
4) Late Expansion – Flat Yield Curve and Low Volatility
Plotted, the cycle looks like this for the 1990s period;
As well as the 2000s;
Given our current position in the Equity Volatility-Yield Curve cycle, we might be bracing for higher volatility ahead as we're likely situated near the cycle's bottom left quadrant.
If the trifecta of rising yields, waning AI hype, and a nascent high-volatility regime comes to fruition, then investing in tail hedges might be a savvy move.
One potential structure for a tail hedge could be the 1X2 ratio put spread. This strategy could offer protection against adverse market movements, with the flexibility to structure it so that initial costs could be negligible or even result in a net credit. Additionally, the put ratio is typically a long vega strategy, which could be beneficial in a high-volatility environment.
The 1X2 ratio put spread can be set up by taking 2 positions,
1) A short position on the Nasdaq 100 Index Futures with a strike price below the current level
2) A long position on 2 Nasdaq 100 Index Futures with a strike price further below the short option strike
At the current index level for the Nasdaq 100 Futures March 2024 contract of 15,520, we could take a short position on the March 2024 put option with a strike price of 14,800 at 304.25 points credit and 2 long positions on the March 2024 put option with a strike price of 13,800 at 122.5 points debit. The setup cost of the put ratio is 304.25 – (2 * 122.5) = 59.25 points, resulting in a net credit. The maximum loss occurs when the underlying asset settles at 13,800 by option expiry, leading to a potential maximum loss calculated as follows:
Long put options both expire worthless: -122.5 * 2 = -245 points
Short put option: 13,800 – 14,800 = -1000 + 304.25 = -695.75 points
Maximum loss = 940.75 points
Considering the potential for loss and the associated risks, several profit scenarios emerge. If, as we discussed, the yield trend shifts and the AI hype subsides, the Nasdaq could potentially plummet. If the Nasdaq falls beyond the 13,104 level by option expiry, the strategy could be profitable. Conversely, if the Nasdaq remains range-bound at its current level or rises by expiry, we could also benefit from the initial credit received. Each 0.25 index point is equivalent to $5.
The charts above were generated using CME’s Real-Time data available on TradingView. Inspirante Trading Solutions is subscribed to both TradingView Premium and CME Real-time Market Data which allows us to identify trading set-ups in real-time and express our market opinions. If you have futures in your trading portfolio, you can check out on CME Group data plans available that suit your trading needs www.tradingview.com
Disclaimer:
The contents in this Idea are intended for information purpose only and do not constitute investment recommendation or advice. Nor are they used to promote any specific products or services. They serve as an integral part of a case study to demonstrate fundamental concepts in risk management under given market scenarios. A full version of the disclaimer is available in our profile description.
Reference:
www.yardeni.com
www.cmegroup.com
www.cmegroup.com

Long LILMNot sure what this company does but volatility is A+. Got distracted and didn't capitalize on this obvious price action like I should have....but had a decent long earlier this year. Small size long here, something stopped the downward momentum and worth a punt. Not advise, good luck.

IBB d2 accumulation buy/hold setup 40% gains🔸Hello guys, today let's review 2daily chart for IBB . Entering re-accumulation
stage now, expecting range bound trading during autumn time season.
Range defined by range highs set at 135 usd and range lows at 117 usd.
🔸Similar fractal observed in 2018/2019. Faded into range after heavy spike,
re-accumulation then 50% pump later during spring 2020.
🔸Recommended strategy bulls: wait for pullback to complete and reload low
near range lows close to 111/113 usd (premium prices). TP1 bulls +20% gains,
TP2 bulls +40% gains. buy/hold setup for patient traders. good luck!
🎁Please hit the like button and
🎁Leave a comment to support our team!
RISK DISCLAIMER:
Trading Futures , Forex, CFDs and Stocks involves a risk of loss.
Please consider carefully if such trading is appropriate for you.
Past performance is not indicative of future results.
Always limit your leverage and use tight stop loss.

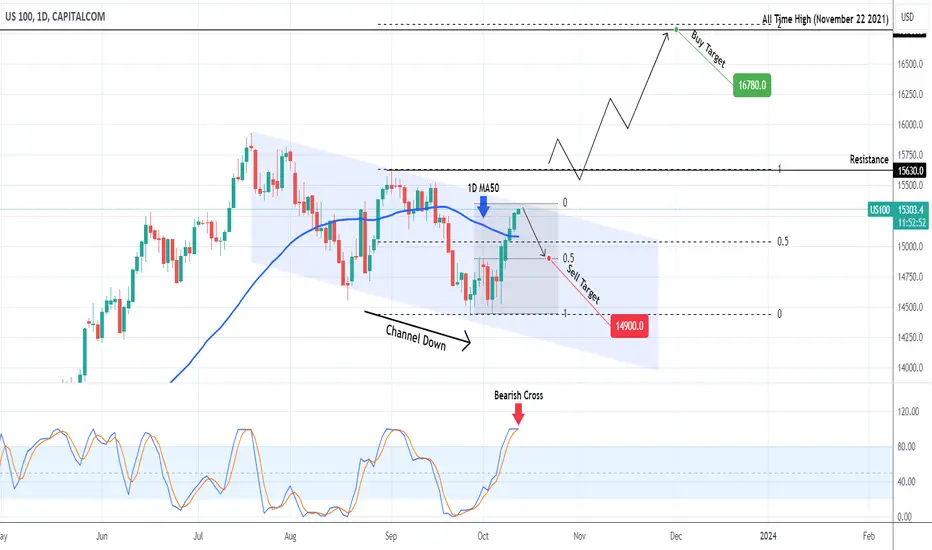
NASDAQ Channel Down or Bullish Flag?Nasdaq (NDX) broke above the 1D MA50 (blue trend-line) and has almost reached the top (Lower Highs trend-line) of the Channel Down pattern that started after the July 19 High. The 1D STOCH RSI Bearish Cross suggests that this is a sell opportunity on the short-term at least, towards 14900 (0.5 Fibonacci retracement level).
But what if this is not a Channel Down but a Bullish Flag pattern after a relentless 2023 price growth? In that case we will need to wait for confirmation in the form of a break-out above the last Lower High (and current Resistance level) at 15630. After that, we will buy the first pull-back below it and target the 16780 All Time High of November 2021, which interestingly enough is only a fraction below the 2.0 Fibonacci extension, a standard technical target in case of Bullish Flag break-outs.
-------------------------------------------------------------------------------
** Please LIKE 👍, FOLLOW ✅, SHARE 🙌 and COMMENT ✍ if you enjoy this idea! Also share your ideas and charts in the comments section below! This is best way to keep it relevant, support us, keep the content here free and allow the idea to reach as many people as possible. **
-------------------------------------------------------------------------------
💸💸💸💸💸💸
👇 👇 👇 👇 👇 👇
NASDAQ Short term Resistance sell but buy if 15520 breaks.Nasdaq / US100 is about to hit our second target (chart at the end) as it is approaching the Falling Resistance.
Our strategy was purely based on the identical patterns of July-August and September-October.
The index is close to a 4hour MA50-100 Bullish Cross, signalling the end of this uptrend.
We estimate a peak no more than 15350. If accompanied by a 4hour MACD Bearish Cross, sell and target 15050 on the short term (course of 4hour MA50).
If though the price crosses above Resistance A (15520), wait for a MA50 pull back and buy targeting 15930 (Resistance B).
Previous chart:
Follow us, like the idea and leave a comment below!!

Nasdaq looking very bearish. Short term support has been broken. A consolidation zone has been broken to the downside. Good time to hedge/Short. Large caps underperforming.

SQQQ's Steep Drop From Yellow Sell ZoneIn my previous update I emphasized that this yellow sell zone is a very strong resistance level for SQQQ. There was a lot of uncertainty surrounding the Friday jobs data, but the data came in very strong and almost double expectations. This led to a bullish rally for TVC:NDQ and SP:SPX that led to steep bleeding for SQQQ. I predicted that SQQQ will drop below the green support level over the next few months, these are my updated price targets on the way down.

$SPX almost like clockwork to 2022TVC:NDQ has traded back above the NECKLINE (from Head & Shoulders Break down) - Amazing!!!
DJ:DJI has not traded above and neither has the $SPX.
In this chart we see the SP:SPX illustrating the resemblance to 2022.
We've been showing this chart for some time now.
It's amazing how similar they are trading.
AMEX:TYD is running today (leveraged bonds ETF) likely an anticipated demand for "safety" causing #yields to fall.
SGX:SQQ NASDAQ:TQQQ NASDAQ:SQQQ
AMEX:DIA AMEX:UDOW AMEX:SDOW
AMEX:SPY AMEX:SPXL AMEX:SPXS

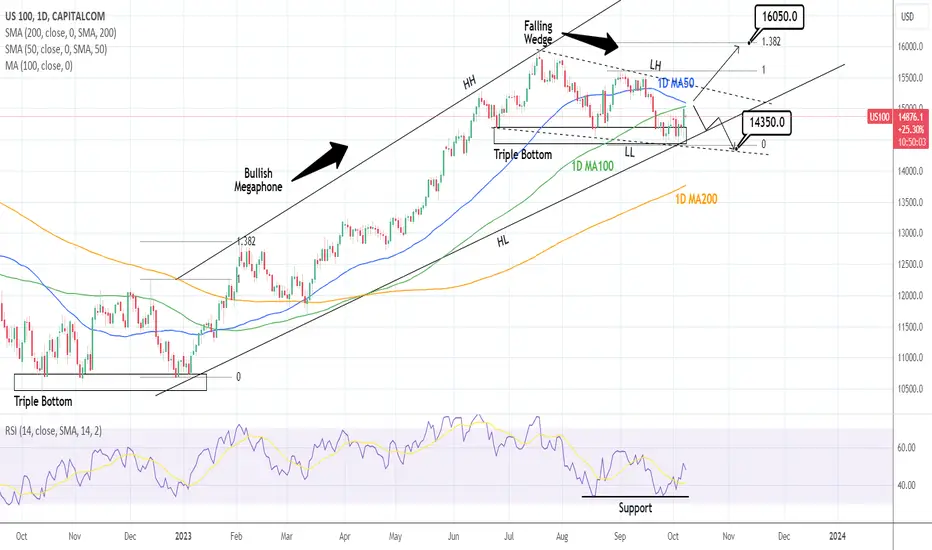
NASDAQ: Will it reverse to Bull or downtrend will make a new LowNasdaq is on two conflicting patterns on the short and long term. The Bullish Megaphone that drove it out of the Bear Cycle after the late 2022 Triple Bottom is still holding and closed last week with an emphatic rebound but at the same time so is the short term Falling Wedge that started the correction on the July 19th High. This conflict and medium term balance is why the 1D technical outlook is neutral (RSI = 48.115, MACD = -63.170, ADX = 38.959).
The 1D RSI may have held August's Support and we could have a Triple Bottom since June, not much different than the late 2022, but it is the 1D MA100 that will make all the difference. A two 1D candle close over it, will amplify the probabilities for a break of the Falling Wedge and long term bullish reversal, in which case we will target the 1.382 Fibonacci extension (TP = 16,050). If we don't see such 1D MA100 closing pattern, we will stay bearish, gradually aiming for the 1D MA200 (TP = 14,350).
## If you like our free content follow our profile to get more daily ideas. ##
## Comments and likes are greatly appreciated. ##