NDX-Market fall is related to the trendline breakDid you know this market geometry, symmetry:
When a (strong) trendline is broken, the market will fall equal distance or more from the trendline as from the peak to the breakpoint. I have shown example of Nasdaq from the past.
This is also true for the reverse, a falling trendline break can predict the upside target
Hope this is useful in your trading
What it means is you might see a small upside from here, but since its already broken the trendline, it will trap the buyers and then do a hard U turn to the downside. I would wait for a bullish pattern to develop before going in long. Be careful of traps!
NASDAQ 100 CFD

NASDAQ: 4H MA50 broke. Time for a full recovery.Nasdaq is still bearish on its 1D technical outlook (RSI = 39.669, MACD = -426.120, ADX = 56.837) but crossed above its 4H MA50. The last time a bearish wave of this Channel Down crossed above the 4H MA50 was on August 9th 2024. It was achieved again after an oversold 1D RSI bounce and initially hit the 0.786 Fibonacci level and then peaked on the 1.382 Fib extension. The trade is long, TP1 = 21,500 and TP2 = 23,400.
## If you like our free content follow our profile to get more daily ideas. ##
## Comments and likes are greatly appreciated. ##

Will the spring & summer of 2025 conclude our retrace in minor BIn the interest of full disclosure we have not even confirmed our minor A has in fact bottomed...but assuming we have struck a short term bottom, we are now embarking on a minor B wave retrace that I anticipate taking us into the start of summer.
In any respect, I am viewing this as only a counter trend rally with a scary (c) of C of (A) to come into the low SPX 5,000 region eventually. There everything gets decided for the long-term.
Be careful out there.
Chris

NASDAQ Most critical 4H MA50 test in 7 months!Nasdaq (NDX) has been trading within a Channel Up since the July 11 2024 High. The price action since the February 18 2025 High was been the patterns Bearish Leg and like the August 05 2024 bottom on the Higher Lows trend-line, it was done on an oversold (<30.00) 1D RSI.
Now that the price has Double Bottomed and bounced, it came across today with a 4H MA50 (blue trend-line) test. 7 months ago it was that test and eventual break-out that initiated Nasdaq's 4-month non-stop rise. Initially once broken, the first target was just below the 0.786 Fibonacci retracement level.
As a result, you can get a confirmed buy signal once the index closes above the 4H MA50 and target 21450 (just below the 0.786 Fib).
-------------------------------------------------------------------------------
** Please LIKE 👍, FOLLOW ✅, SHARE 🙌 and COMMENT ✍ if you enjoy this idea! Also share your ideas and charts in the comments section below! This is best way to keep it relevant, support us, keep the content here free and allow the idea to reach as many people as possible. **
-------------------------------------------------------------------------------
💸💸💸💸💸💸
👇 👇 👇 👇 👇 👇

Nas100 buy anticipation Yo! It's a new week. I'm assuming this week is going to be bullish. Let's see what price is going to do.
ToWhomItMayConcern 🫴

NASDAQ (1h) Golden Cross broke above the 3 week downtrend.Nasdaq has formed a Golden Cross on the (1h) time frame while also crossing above the Falling Resistance of the last 3 weeks.
This is a bullish reversal break out.
Trading Plan:
1. Buy on the current market price.
Targets:
1. 20370 (the 2.0 Fibonacci extension from the last high).
Tips:
1. The RSI (1h) as already been on a Rising Support, hence bullish divergence since yesterday.
Please like, follow and comment!!

Gold takes Adv. since Trump-a-rally pans out to Bulls fartIt's gone 2 weeks or so, since Mr. Trump has secured a win over his Democrat-rival Kamala Harris in the 2024 U.S. presidential election, as it declared by the Associated Press.
Since that, a lot of stocks soared in a meme-style mode, while Bitcoin clears $93,000 and Dogecoin soared amid Trump-fueled crypto rally.
Among nearly 2000 components of Smallcap Russell 2000 Index TVC:RUT , appr. 90 percent of them (without any fundamental reasons) were up on November 6 - at the day Trump clinched White House victory.
For S&P 500 SP:SPX and Nasdaq-100 NASDAQ:NDX indices these numbers were 70 and 75 percent respectively.
Since US dollar interest rates are still near multi year highs and Powell still says the Fed is in no hurry to cut interest rates.. all of that means Trump-a-rally gives no light for super-duper bets, as it's been discussed in earlier posted ideas.
Moreover, Geopolitics is roaring back, as current U.S. President Joe Biden tries to authorize the yellow-blues to use powerful long-range American-made weapons inside Russia's legal areas, potentially inside Kursk region where located The Kursk Nuclear Power Plant, that is one of the three biggest nuclear power plants (NPPs) in Russia and one of the four biggest electricity producers in the country.
The main graph is for Gold spot OANDA:XAUUSD , and it indicates on Cup with Handle technical structure in development as Gold takes Adv. since Trump-a-rally pans out to Bulls fart.

NASDAQ about to nuke?In my previous ideas and posts i told you about #nasdaq chart structure' s weaknesses. Well, it has already made the extended rally and the time has likely come.
In lower time frame, nasdaq, spx and dji already started dumps and broke the local supports.
In monthly candle stick size, i mean higher time frame, #nasdaq100 chart:
- Formed a huge bearish divergence
- Stoch RSI made bearish triple top
- MACD is warning about the trend reversal (Bullish to bearish)
The strong support zones in HTF are:
Monthly EMA Ribbon at 15000
Monthly İchimoku Cloud bottom at 12000
The stronghold the historical trendline support at 6000.
This strategy is NOT a SHORT TERM strategy and NOT FINANCIAL ADVICE. Dyor.
Just avoid being over greedy.

Bearish & Boring? Maybe. Profitable? Definitely.Bearish & Boring? Maybe. Profitable? Definitely. | SPX Market Analysis 12 Mar 2025
You know that feeling when you wake up and wonder if you’re stuck in a time loop? Yeah, me too.
For what feels like the hundredth time, I’m reporting that the bear move is grinding lower. The difference? The profits keep stacking up—so I’m not complaining.
Yesterday’s rally was supposedly triggered by Canada pausing tariffs, but let’s be real—this market is looking for any excuse to bounce. Yet, the overall trend remains the same: a slow, stair-stepping drop. Based on this drop-pause-drop rhythm, I suspect we’re entering the next pause before another leg down.
My bear boots are full, my trade allocations are set, and I’m waiting for two tranches to exit profitably before considering any new plays. Until SPX clears 5850, the bullish setups stay on the shelf.
This is the good kind of waiting—the kind where the market moves for me instead of me chasing it.
---
Deeper Dive Analysis:
If it feels like Groundhog Day, you’re not alone. The bearish grind continues, slowly pushing lower, delivering small but steady wins. Unlike a panic-driven crash, this move is unfolding in slow motion, keeping traders on edge, wondering if a rally is lurking around the corner.
📌 A Market Looking for an Excuse to Bounce
Yesterday’s rally attempt was supposedly fueled by news that Canadian tariffs were being paused, but let’s be honest—this market is desperate for any reason to move higher. The reality? The larger bearish structure remains intact.
Every bounce so far has been short-lived.
The market keeps following a drop-pause-drop pattern.
We’re likely entering the next "pause" phase before another move down.
📌 My Trading Approach—Locked, Loaded, and Waiting
Right now, my bear boots are full, meaning I’m not adding new positions until my current tranches exit profitably.
Two tranches are set to exit with profits by the end of the week.
If we push lower or continue sideways, I’ll take my exits and reassess.
Until SPX clears 5850, I won’t even think about bullish setups.
📌 What’s Next? The Good Kind of Waiting
There’s no need to chase trades or force new entries. I’m simply letting my plan play out. If the market continues its slow-motion decline, I’ll collect my wins, reload selectively, and wait for the next prime setup.
For now, I sit back and enjoy the show—because this time, the market is working for me, not against me.
---
Fun Fact
📢 Did you know? In 2008, Porsche trapped hedge funds in one of the greatest short squeezes in history, briefly making it the most valuable company in the world—all thanks to a secretive stock manoeuvre.
💡 The Lesson? Markets don’t just move up and down—they can also turn traders inside out. The wrong bet at the wrong time can be devastating… unless, of course, you have a system that keeps you on the right side of the trade. 🚀

NASDAQ: Oversold at the bottom of 8month Channel Up.Nasdaq is oversold on its 1D technical outlook (RSI = 26.693, MACD = -501.840, ADX = 53.670), which is the most oversold 1D RSI reading since August 15th 2015. In the meantime, it touched the HL bottom of the 8month Channel Up, a bearish wave that looks much like July 2025. The bullish wave that followed topped on the 1.382 Fibonacci extension. If candle closings are contained inside the Channel Up, we expect it to attract a lot of new buyers and initiate the new bullish wave to at least the same Fib. Long trade, TP = 23,400. A closing under the Channel Up, should test though the 1W MA100 (TP = 18,000).
## If you like our free content follow our profile to get more daily ideas. ##
## Comments and likes are greatly appreciated. ##

18 Times, +2000%, 5800 Days - All About NASDAQ100 Corrections!Hi, all!
I need to repost some of my recent ideas on TradingView due to issues with the platform's moderation. Let's start! The most up-to-date post is coming right away - one that serves as a timely reminder during these interesting times: never forget history.
From November 2008 to February 2025, the Nasdaq 100 (NDX) index has grown by over 2000%! Yes, that’s a 20x increase! This tech giant, made up of the 100 leading technology stocks, has shown impressive strength.
For comparison, the S&P 500 has risen about 820% in the same period. A great performance but Nasdaq 100 leaves it far behind.
Has this been a straight-line rise? Not really. Looking back, it may seem like the perfect investment. But the road was not smooth. Nasdaq 100’s success came with painful drops, investor panic, and moments when it felt like the market would never recover.
From the outside, everything looks great. But would you sit through a 30% drop, while the news is screaming about the "end of the world"?
So, I decided to analyze every correction of 10% or more since the market bottom in 2008.
- How long do corrections and recoveries last?
- How often do they happen?
- What should investors know?
- Can this help you in any way?
DATA ANALYSIS - 18 corrections in Nasdaq 100 (2008–2025), -10% or more.
Retracement Stats:
- Average drop: -15%
- Median drop: -13%
- Biggest drop: -37.72%
- Smallest drop: -10%
Correction Length (17 completed corrections): How many days does a correction last from the peak to the bottom?
- Average: 60 days
- Median: 35 days
- Longest: 325 days
- Shortest: 14 days
Recovery Time: From bottom back to new highs.
- Average: 165 days (~5.5 months)
- Median: 119 days (~4 months)
- Longest: 752 days (over 2 years)
- Shortest: 42 days (~1.5 months)
Correction Frequency
If we take a rough estimate, in 5800 days, there were 18 corrections, which means a correction happens every 322 days (~10.5 months) on average.
Total Time Spent in Corrections vs. Rising Markets
- Corrections lasted 1016 days
- Recoveries lasted 2801 days
- Total time spent in "work mode": 3817 days
- Total "smooth uptrend" days: 1983 days (~5.4 years)
Basically, like a hardworking employee – the market spends more time struggling than rising!
What Can Investors Learn from This?
1. Accept Volatility
Knowing that market swings are normal, investors can keep a long-term perspective and avoid panic-selling during downturns.
2. Nasdaq 100 Has Always Recovered
In the long run, Nasdaq 100 has always bounced back to new highs. Each recovery has been different, but so far, making new all-time highs has never been a problem.
3. Make Better Decisions
Understanding psychological biases helps investors make rational choices and manage risks better.
4. Market Drops = Opportunities, Not Threats
Most big market rallies started when most investors were too scared to buy.
"A simple rule dictates my buying: Be fearful when others are greedy, and be greedy when others are fearful." – Warren Buffett
Market drops always feel unique and scary but history shows they follow repeating patterns. And those who keep their emotions in check have the best opportunities.
"The time to buy is when there's blood in the streets." – Baron Rothschild
Final Thoughts: Is the current retracement a buying opportunity? No one knows for sure but history suggests - stay calm!
So, that's all. Like & Boost if you find this useful! 🚀
Have great day,
Vaido
💬 Before you leave... What’s your take on the current Nasdaq 100 correction? Drop your thoughts in the comments 👇
NASDAQ below its 1W MA50 after 2 years. Doom or recovery ahead??Nasdaq (NDX) broke below its 1W MA50 (blue trend-line) for the first time in 2 years (since week of March 13 2023). That is a strong long-term Support, in fact it is technically the first level to look for during cyclical bull trends. So how bad can a break and/or 1W candle closing below it?
As you can see on this multi-year chart on the 1W time-frame, since the 2008 Housing Crisis, the index has had a number of breaks below its 1W MA50. With the exception of the 2022 Inflation Crisis, which was a cyclical Bear Market like 2008, all of those breaks were short-lived and rebounded on the 1W MA100 (green trend-line) almost instantly.
In fact, the current technical pull-back resembles the June - August 2011 correction, which after breaking below the 1W MA50, it found support and rebounded on the 1W MA100 in 2 weeks. The rebound that followed rose by +38% in 7 months. If a similar development is followed, which is what we expect, we are looking at a potential end-of-year rally to 24900. This also took place on the 2019 rally.
What makes this 17-year recurring pattern even more interesting is that technical pull-backs such as the current, tend to take place when the 1W RSI Channel Down, a technical Bearish Divergence) hits 40.00 and makes a Lower Low (green circles).
-------------------------------------------------------------------------------
** Please LIKE 👍, FOLLOW ✅, SHARE 🙌 and COMMENT ✍ if you enjoy this idea! Also share your ideas and charts in the comments section below! This is best way to keep it relevant, support us, keep the content here free and allow the idea to reach as many people as possible. **
-------------------------------------------------------------------------------
💸💸💸💸💸💸
👇 👇 👇 👇 👇 👇

NASDAQ 100 Elliott Wave Analysis – A High-Probability Setup in P📌 Is the NASDAQ 100 in a Bearish Impulse Wave?
Based on Elliott Wave analysis, NASDAQ 100 appears to be in Wave 3 of an ongoing bearish impulse (Wave A or 1). This setup suggests that after the current downward move, we might see a corrective structure before another leg down.
Key Insights:
🔹 Wave Structure: The first wave of this move was a leading diagonal, followed by a pullback. Now, we are likely in Wave 3, which could extend further before a corrective phase begins.
🔹 Retracement Zones: After Wave 3 completes, we expect a corrective structure (Wave 4), which typically retraces between 38.2% and 50% of Wave 3 before Wave 5 resumes.
🔹 Trading Strategy: The most favorable entry zone would be during Wave 5 of A (or 1), ideally in lower timeframes such as H1, H4, or even M15. Before entering a trade, we need to confirm a three-wave corrective structure—whether it forms a sideways correction or a complex zigzag.
📌 Critical Levels to Watch:
A break into Wave 1 territory could invalidate the impulse structure and shift the outlook.
If the corrective phase is shallow, a deeper drop may still be on the table.
🚀 Patience is key! Once the correction completes, the next move could offer a strong trading opportunity.
#NASDAQ100 #ElliottWave #StockMarket #TradingSetup #BearishImpulse
💬 What’s your take? Are we heading lower, or will the market surprise us?

NASDAQ Futures Fall Following S&P's Worst Week Since SeptemberUS stock futures fell solidly Monday as investors and traders took the weekend to process the February jobs report and prepared for a busy week of economic data, headlined by a report on inflation amid concerns over its resurgence under President Trump's unpredictable trade policy.
Dow Jones Industrial Average futures (YM=F) fell 1%, while futures attached to the benchmark S&P 500 (ES=F) also dropped 1% after the index posted its worst week since September. Futures tied to the Nasdaq (NQ=F) also slipped around 1.79%.
All three major indexes looked set to build on losses of more than 2% last week.
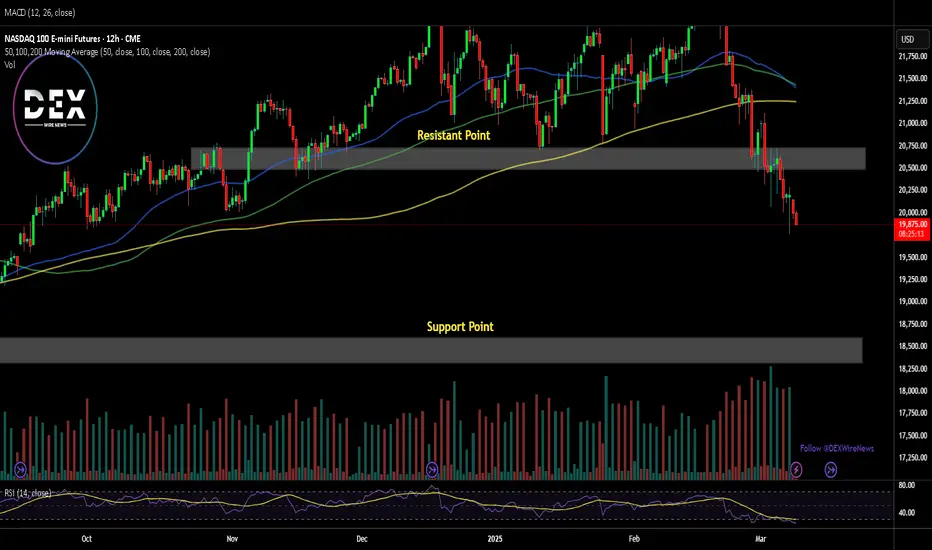
For the Nasdaq Composite, the resistance point has been faded with selling pressure increasing, the 18,500 point could serve as support point for Nasdaq price index. However, should a trend reversal occur, the break above the resistant pivot may catalyse a bullish spree as industries, investors and traders are dissecting President Trump's trade policy.
Nasdaq market analysis: 10-Mar-2025Good morning! Happy New Week! Happy New Day ! Here's your daily Nasdaq market analysis. Learn, grow, and trade wisely.

Validation of a long term top in the SPX continues to playballLast week I posted an update on my SPX cash index analysis...found below.
At the end of last week, we see where the price action has been filling in nicely as of Friday. Some key take-a-ways. First, is the price action has breached the area that I am counting as the wave 4 of one lesser degree. This would be an initial clue that the bull market pattern that started back in August of last year is cracking. This would be the area that I am counting as the intermediate wave (4). I am forecasting this recent price action down is the Minor A wave of the beginning of a stair stepped decline that has a high probability of coming back into that area of the August 2024 lows after we retrace higher in a minor B wave, labeled in Red.
What's important about price coming back into this area of approximately 5121-4950 is this the area that price could hold and manage a higher high, essentially meaning that my count is off by one degree...and what I am counting as a wave (III) super-cycle top will get pushed out to end of 2025-2026. However, to breach this area even incrementally, would provide much the same clues we're getting now, about price breaching the minor wave 4 of one lesser degree.
Below this must hold area, is where my forecast of a super-cycle wave (III) gets confirmation...until then we look for clues of validation...but confirmation does not come until price cane breach this area. To breach this area would reflect in price action that resembles the below.

Nasdaq market analysis: 07-MAR-2025Let’s dive into today's Nasdaq market analysis. Share insights, and potentially spot opportunities for good pips.

NASDAQ Ultimate Support test on the 1week MA50.Nasdaq / US100 is trading inside a Channel Up since the start of this Bull Cycle after the late 2022 bottom.
The price is about to test the 1week MA50, which is the ultimate Support of this bullish trend and has been holding since March 13 2023 (almost 2 years).
It is important for the index to keep a weekly closing over it. If it does we will have the most optimal buy entry case.
The previous two bullish waves interestingly enough both increased by +49.55%.
Buy and target 25500.
Follow us, like the idea and leave a comment below!!

NASDAQ: 4H Death Cross always signals a rally.Nasdaq in bearish on its 1D technical outlook (RSI = 38.073, MACD = -289.260, ADX = 41.209) as the mid February bearish wave hit the bottom of the September Channel Up. The formation of a Death Cross on the 4H timeframe has favored buying inside this pattern. In the meantime, the 4H RSI has been rising while the price was correcting, indicating the presence of a Bullish Divergence. Buy and aim for another +16% rise (TP = 23,200).
## If you like our free content follow our profile to get more daily ideas. ##
## Comments and likes are greatly appreciated. ##

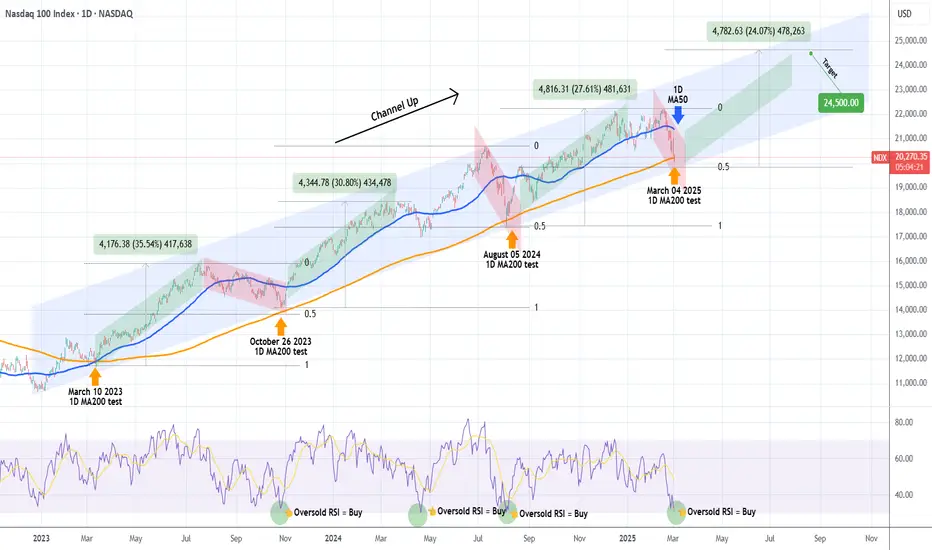
NASDAQ hit its 1D MA200. Strongest buy signal in 2 years!Nasdaq (NDX) hit today its 1D MA200 (orange trend-line) for the first time in 7 months (since the August 05 2024 Low) with its 1D RSI almost oversold (below 30.00). In the past 2 years (since the March 10 2023 test), the 1D MA200 has been tested another 3 times, all of which have been the absolute technical buy entries, kick-starting enormous rallies.
On top of that, the price is close to the bottom (Higher Lows trend-line) of the long-term Channel Up that started on the December 2022 market bottom. Every rally that followed after a 1D MA200 test has been marginally weaker than the previous but all three have been around +30% on average. The last one has been +27.61%, which is -3% weaker than the previous.
As a result, we are expecting a new rally to start now as all buy conditions within a 2-year span have been met (1D MA200, oversold 1D RSI) that can target 24500, which represents a +24.00% rally (-3% shorter rise than the previous).
-------------------------------------------------------------------------------
** Please LIKE 👍, FOLLOW ✅, SHARE 🙌 and COMMENT ✍ if you enjoy this idea! Also share your ideas and charts in the comments section below! This is best way to keep it relevant, support us, keep the content here free and allow the idea to reach as many people as possible. **
-------------------------------------------------------------------------------
💸💸💸💸💸💸
👇 👇 👇 👇 👇 👇
NASDAQ ENTRY ON THE FLOOR?! 4H chart Sep-Feb 27.2.25Simple up-trend with a recent confirmation of support.
September24 to Feb 25 is consistent and predictable with an average 7 to 11% rise from the support within a time frame of up to 6 weeks.
If the price closes a 4h candle below the line (20,850) - Up-trend will be broken, as long as the price keeps above, aiming for $800-$1500 swing trade up can be very profitable.
Make logical, consistent decisions based on an overall plan with risk management as top priority.

Nasdaq trading insights: 27-Feb-2025Nasdaq trading insights: Not signals, but informative zones to aid your decision-making. Please note: These zones are not trading advice. Use them as a starting point for your own analysis.

NASDAQ: Broke into the 2 year Support Zone.Nasdaq has turned bearish on its 1D technical outlook (RSI = 41/199, MACD = -42.030, ADX = 30.270) as the correction that started last Thursday hit the 1D MA100. The region between the 1D MA100 and 1D MA200 is the index's 2year Support Zone and has been a buy opportunity since February 2023. With the 1D RSI also on 6month lows, the current level is low enough to be a HL on the long term Channel Up, after which rallies to the 3.5 Fibonacci extension have started. Go long, TP = 24,000.
## If you like our free content follow our profile to get more daily ideas. ##
## Comments and likes are greatly appreciated. ##
