Microsoft Corp. Goes Bullish? ... The New World Order!You know how you get to see all the headlines when browsing through TradingView's homepage, impossible to avoid.
We love it because it gives me so many ideas...
"Microsoft Better Than Hot Bread".
"Microsoft Develops New Air Conditioner That Will Override The Fed".
"Microsoft Comes Up With Better Than Bacon".
Etc.
It is very misleading, that's our point.
Whenever the market is about to crash, all the news website start publishing bullish headlines.
Whenever the market is about to rise, all the news website start publishing bearish headlines.
Today we have so many bullish headlines for the stock market, the SPX, etc.
See what happens in a few days.
Microsoft Crop. (MSFT) uptrend is ending after 13 years.
This can turn into a simple, normal, classic correction or maybe it can get really bad.
We are looking at the monthly timeframe and MSFT is still trading below EMA10. Bearish.
Clear downtrend since November 2021. Bearish.
Decreasing volume. Bearish.
What an incredible ride... Can't wait to see how it will all develop...
Sam-FTX just got arrested in Bahamas...
Out of crisis comes opportunity.
Once we hit rock bottom, the only place left to go is up.
It is the end of an era.
The birth of a new order.
Order out of chaos.
A New World Order?
Namaste.
NASDAQ 100 CFD

NDX Daily Bearish SignalsWe have a downtrend within a downtrend, the inception of bearish signals.
The NDX printed a shooting star candlestick yesterday as a rejection from EMA10.
The RSI has gone bearish and the QStick indicator as well.
The feeling is that it should be mild yet, we are seeing a strong crash ahead.
Maybe even a 10 percent drop in a matter of days.
Just hoping that we are wrong.
Namaste.

NAS100 NQ1! NASDAQ 2022 Dec 12
NAS100 NQ1! NASDAQ 2022 Dec 12
NQ was resisted at 12140, so scenario2 short worked well.
I will be off trading to enjoy the holiday season, hope you get some rest and refreshing
for this season as well.
Repeating again that volume is expected to remain thin, it will be cheaper to whipsaw the market.
Speaking plainly, its means it will be a lot easier for the Smart Money to hunt your stops.
Possible scenarios:
1) Preferred scenario: Take a well-deserved break, review your trading, and come back with much
clarity, purpose and wisdom for the year 2023.
2) Rotation zone 12140 - 10710: Trades can be executed at boundary of range.
Although not expected to happen, still keeping the breakdown / breakout scenario for future reference:
3) Breakdown scenario if redistribution schematic is fulfilled
= Short on test of breakdown of 10890 / 10485
4) Breakout of rotation = possible long if price continues to trade
at upper boundary of rotation zone.
Daily = UT observed for possible short opportunity
H4 = UT supply> demand = possible short opportunity
Price reaction levels:
Short on Test and Reject | Long on Test and Accept
12987 12140 11455
10710 10485 10000
9748
Remember to Like and Follow if you find this useful.
Have a profitable trading week ahead.

Fresh Week New highs ?Just bought at 11800 and looking to hit 12.1k now potentially. If this area breaks we are heading towards 12.5k levels easily and the xmas rally begins!

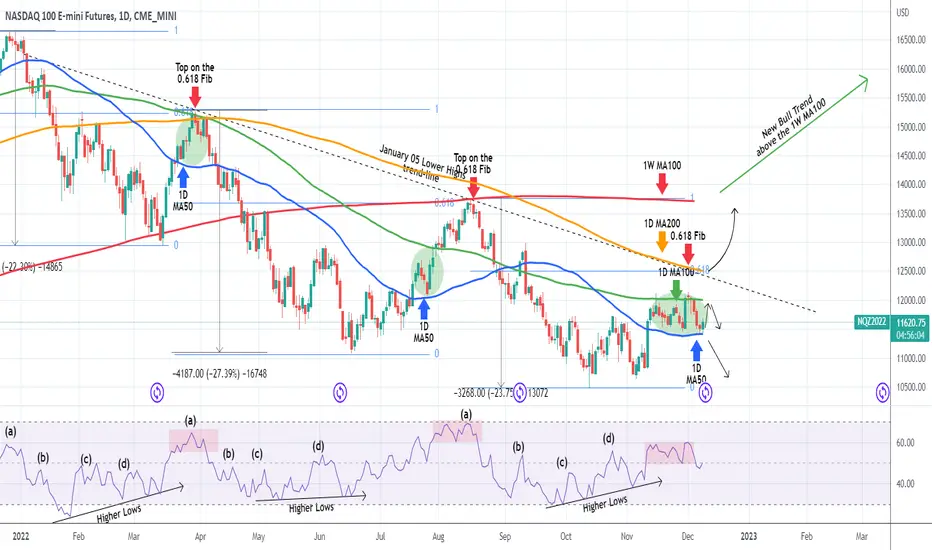
NASDAQ Almost 1 month trapped within the 1D MA50 - MA100Nasdaq (NDX) has been trading sideways since November 10, with the 1D MA50 (blue trend-line) as Support and the 1D MA100 (green trend-line) as Resistance. On a wide scale, this technically looks like the previous two market tops on the January 05 Lower Highs trend-line, and the 1D RSI illustrates that clearly. However, the Jul 19 - 28 consolidation within the 1D MA50/100 zone, did make a higher extension, so it is best to stay on the sidelines until we have a clear, confirmed break-out signal.
As long as the price remains within the 1D MA50 and 1D MA100, short-term traders can scalp the range. Since the January 05 Lower Highs trend-line is getting closer and closer to the 1D MA100, there is high risk in taking a buy break-out trade there. As the 1D MA200 is unbroken since April 05, it is best to take the break-out buy if a 1D candle closes above the 1D MA200 (orange trend-line), which would be also a break above the 0.618 Fibonacci level and target the 1W MA100 (red trend-line), which would be also a test of the 13,760 August 16 High.
On the other hand, a 1D candle close below the 1D MA50, would be bearish targeting 10850 and quite possibly aiming at a new (Lower) Low.
Notice that the 0.618 Fibonacci level is a critical Resistance level as it is where Nasdaq topped both on the March 29 and August 16 Lower Highs.
Also notice that the 1W MA100 is where the August 16 High was rejected.
-------------------------------------------------------------------------------
** Please LIKE 👍, SUBSCRIBE ✅, SHARE 🙌 and COMMENT ✍ if you enjoy this idea! Also share your ideas and charts in the comments section below! This is best way to keep it relevant, support me, keep the content here free and allow the idea to reach as many people as possible. **
-------------------------------------------------------------------------------
You may also TELL ME 🙋♀️🙋♂️ in the comments section which symbol you want me to analyze next and on which time-frame. The one with the most posts will be published tomorrow! 👏🎁
-------------------------------------------------------------------------------
💸💸💸💸💸💸
👇 👇 👇 👇 👇 👇

Nasdaq Weekly Volatility Analysis 5-9 Dec 2022 Nasdaq Weekly Volatility Analysis 5-9 Dec 2022
We can see that currently the implied volatility for this week is around 3.72%, down from 3.95% last week according to VXN data
With this in mind, currently from ATR point of view we are located in the 74th percentile, while according to VXN, we are on 41th percentile.
Based on this, we can expect that the current weekly candles ( from open to close ) are going to between:
Bullish: 3.4% movement
Bearish: 3.5% movement
At the same time, with this data, we can make a top/bot channel which is going to contain inside the movement of this asset,
meaning that there is a 23.6% that our close of the weekly candle of this asset is going to be either above/below the next channel:
TOP: 12475
BOT: 11525
Taking into consideration the previous weekly high/low, currently for this candle there is :
78% probability we are going to touch previous high of 12145
26% probability we are going to touch previous low of 11480
Lastly, from the technical analysis point of view, currently from
Weekly timeframe indicates 13% BEARISH trend
Daily timeframe indicates 40% bullish trend
4H timeframe indicates 93.3% bullish trend

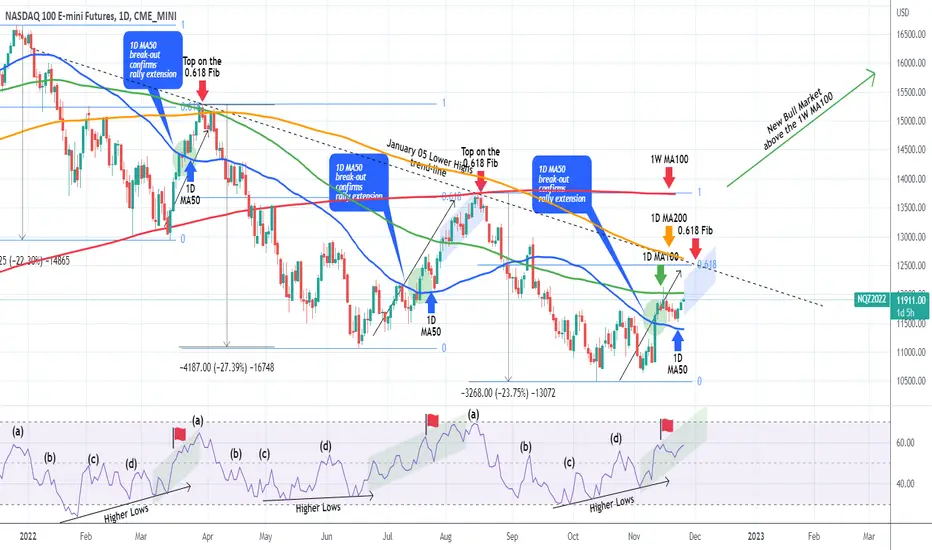
NASDAQ 20 days trapped within the 1D MA50 - MA100Nasdaq (NDX) has been trading sideways since November 10, with the 1D MA50 (blue trend-line) as Support and the 1D MA100 (green trend-line) as Resistance. On a wide scale, this technically looks like the previous two market tops on the January 05 Lower Highs trend-line, and the 1D RSI illustrates that clearly. However, the Jul 19 - 28 consolidation within the 1D MA50/100 zone, did make a higher extension, so it is best to approach this with our usual break-out strategy.
A 1D candle closing below the 1D MA50, would be bearish targeting 10850 and quite possibly aiming at a new (Lower) Low. On the other hand, a closing above the 1D MA100, will be treated as a short-term bullish extension signal to the 0.618 Fibonacci level and the 1D MA200 (orange trend-line), which is where Nasdaq topped both on March 29 and August 16.
A closing above the 1D MA200 would translate into a break above the January 05 Lower Highs trend-line, in which case, we will target the 1W MA100 (red trend-line), which rejected the uptrend last time on the August 16 High.
-------------------------------------------------------------------------------
** Please LIKE 👍, SUBSCRIBE ✅, SHARE 🙌 and COMMENT ✍ if you enjoy this idea! Also share your ideas and charts in the comments section below! This is best way to keep it relevant, support me, keep the content here free and allow the idea to reach as many people as possible. **
-------------------------------------------------------------------------------
You may also TELL ME 🙋♀️🙋♂️ in the comments section which symbol you want me to analyze next and on which time-frame. The one with the most posts will be published tomorrow! 👏🎁
-------------------------------------------------------------------------------
💸💸💸💸💸💸
👇 👇 👇 👇 👇 👇

Nasdaq Weekly Forecast Analysis 28 Nov-2 Dec 2022 Nasdaq Weekly Forecast Analysis 28 Nov-2 Dec 2022
We can see that this week, the current implied volatility is around 4.06% , down from 4.19% of last week.
According to ATR calculations, we are currently on the 78th percentile, while with VXN we are on 39th percentile.
Based on this data, we can expect on average, the movement from open to close of the weekly candle to be :
In case of bullish - 3.43%
In case of bearish - 3.48%
With the current IV calculation, we have currently 23.6% that the close of the weekly candle is going to finish either above
or below the next channel:
TOP: 12223
BOT: 11239
At the same time, taking into consideration the high/low touch calculation from the previous values, we can expect for this week:
25% chance that we are going to touch the previous low of the weekly candle of 11531
77% chance that we are going to touch the previous high of the weekly candle of 11931
Lastly from a technical analysis point of view, currently 40% of the moving averages rating, are insinuating we are in a BEARISH trend.

NAS100 NQ1! NASDAQ 2022 NOV 28 Nov
NAS100 NQ1! NASDAQ 2022 NOV 28 Nov
Apart from the rotation long from week of 7 Nov, nothing eventful
happened the last 2 weeks as NQ traded in narrow range.
Holiday season has kicked in, volume expected to remain thin.
Price may just slowly float upward due to lack of selling.
Possible scenarios:
1) Rotation zone 11730 - 10710: Trades can be executed at
boundary of range.
2) Short on rejection of 12140 / 11730, target 50% of range // extended target
to rotational support.
2) Breakdown scenario if redistribution schematic is fulfilled
= Short on test of breakdown of 10890 / 10485
3) Breakout of rotation = possible long if price continues to trade
at upper boundary of rotation zone.
Weekly = Unconfirmed UT + ND up bar, possible weakness
Daily = UT observed, possible short opportunity.
H4 = Indecision. Supply and Demand need to resolve,
probably after thanksgiving weekend there'll be an outcome
Price reaction levels:
Short on Test and Reject | Long on Test and Accept
12987 12140 11730
10710 10485 10000
9748
Remember to Like and Follow if you find this useful.
Have a profitable trading week ahead.

Nasdaq 100 target 8000 (short)The final leg of the correction is expected to end with an impulse to 8000
The decline is expected to start from 12200 on tuesday/wednesday

NASDAQ setting course for 12500Nasdaq (NDX) completed its short-term technical pull-back, as it held the 1D MA50 (blue trend-line) after it was rejected on the 1D MA100 (green trend-line). This doesn't change our outlook presented two weeks ago:
This profit-taking retracement was part of the greater plan, as the index remains within the tolerance levels of the previous counter-trend rebounds of the 2022 Bear Cycle, all of whom hit the Lower Highs trend-line that started on January 05.
As you see denoted by the green circle, every break above the 1D MA50 (blue trend-line) made a pull-back to test it as a Support shortly after. In terms of RSI , it appears that relative to the rallies of mid-March and July-August, we are just past the Red Flag. Now the minimum target on this bullish sequence is the Jan Lower Highs trend-line, that most likely will make a match on the 0.618 Fibonacci (as both previous rallies) and the 1D MA200 (orange trend-line) around the 12500 mark.
-------------------------------------------------------------------------------
** Please LIKE 👍, SUBSCRIBE ✅, SHARE 🙌 and COMMENT ✍ if you enjoy this idea! Also share your ideas and charts in the comments section below! This is best way to keep it relevant, support me, keep the content here free and allow the idea to reach as many people as possible. **
-------------------------------------------------------------------------------
You may also TELL ME 🙋♀️🙋♂️ in the comments section which symbol you want me to analyze next and on which time-frame. The one with the most posts will be published tomorrow! 👏🎁
-------------------------------------------------------------------------------
👇 👇 👇 👇 👇 👇
💸💸💸💸💸💸
👇 👇 👇 👇 👇 👇

NDX has a formed a nice decsending triangleThere is two possiblities in this trade. The first 1 good chance it could break to the upside since it is a descending triangle we expect the price to break to the upside. The 2nd scenario, since there is a big gap or imbalance from 10870. If the triangle breaks to the downside there is a good chance it will fill the gap at least 50 %. Good luck!

nasdaq 100 ndx 1 monthnasdaq 100 ndx 1 month
america nasdaq borsa line usdt tether dollar
crypto correlation

Year end Trade Inflation peak / Long YTD losers Short Winners- USD has probably peaked for 2022 post US CPI important release.
- Into year end Trade
- Contrarian Play is to Buy Losers (Coppers, NDX, US Equities, Gold), Sell Inflation winners (WTI, USD, Financial sector, Energy Equities).
- In Commodities I chose WTI as a good proxy
Technicals
Long term Trend is negative on crude since the top in June 2022, we broke decisively on 50-week MA and trading under
Systematic / CTA Positioning is still Long.
Into year end with only 5 weeks left, it's highly likely that the Trend Trade will be unwound, based on very large Standard deviations moves that happened yesterday in macro Space (US10Y, USD, Crude, Equities)

NASDAQ Small technical pull-back part of the plan.Nasdaq (NDX) is on a short-term technical pull-back after it was rejected on the 1D MA100 (green trend-line). This doesn't change our outlook presented last week:
This profit-taking retracement is part of the greater plan, as the index remains within the tolerance levels of the previous counter-trend rebounds of the 2022 Bear Cycle, all of whom hit the Lower Highs trend-line that started on January 05.
As you see denoted by the green circle, every break above the 1D MA50 (blue trend-line) made a pull-back to test it as a Support shortly after. In terms of RSI, it appears that relative to the rallies of mid-March and July-August, we are where the Red Flag is. After the 1D MA50 pull-back is completed, the minimum target on this bullish sequence is the Jan Lower Highs trend-line, that most likely will make a match on the 0.618 Fibonacci (as both previous rallies) and the 1D MA200 (orange trend-line).
-------------------------------------------------------------------------------
** Please LIKE 👍, SUBSCRIBE ✅, SHARE 🙌 and COMMENT ✍ if you enjoy this idea! Also share your ideas and charts in the comments section below! This is best way to keep it relevant, support me, keep the content here free and allow the idea to reach as many people as possible. **
-------------------------------------------------------------------------------
You may also TELL ME 🙋♀️🙋♂️ in the comments section which symbol you want me to analyze next and on which time-frame. The one with the most posts will be published tomorrow! 👏🎁
-------------------------------------------------------------------------------
👇 👇 👇 👇 👇 👇
💸💸💸💸💸💸
👇 👇 👇 👇 👇 👇
NDX 100 , NASDAQ ANALYSIS , 1 WEEKI shared Nasdaq 100 analysis with you
If the price does not close above 12000 $ in the weekly time frame
we can see a drop to the range of 9000 $ to 9500 $
Nasdaq 100 - Signs of exhaustionSince the latest CPI print NQ1! rose approximately 9%, with most of the move-up being manifested right after the release. The move was accompanied by high volume; however, on Friday and Monday, the volume declined substantially. This continuous decline in volume hints at exhaustion and potential reversal. Therefore, we remain very cautious.
To support our thesis, we would like to see a further slump in volume and the price going up. Then, we would like to see this followed by a spike in volume and the start of selling pressure. Contrarily, to invalidate our bearish thesis, we would like to see the price hold above 11 734$. Additionally, we would like to see the pick-up in volume accompanying a move higher.
On the endnote, we still believe this is only another bear market rally, and because of that, we stay bearish beyond the short term and stick to our price target for NQ1! at 10 000$.
Illustration 1.01
Since the latest CPI print, each session after the print manifested a declining volume from open to close. Yellow arrows indicate these developments on the chart.
Technical analysis - daily time frame
RSI, MACD, and Stochastic are all bullish. DM+ and DM- are bullish as well. Overall, the daily time frame is bullish, although the trend remains weak.
Technical analysis - weekly time frame
RSI and Stochastic point to the upside. MACD tries to reverse to the upside but stays in the bearish zone. DM+ and DM- are all bearish. Overall, the weekly time frame is less bearish than the last week.
Please feel free to express your ideas and thoughts in the comment section.
DISCLAIMER: This analysis is not intended to encourage any buying or selling of any particular securities. Furthermore, it should not be a basis for taking any trade action by an individual investor. Therefore, your own due diligence is highly advised before entering a trade.

Bullish NASDAQ WOLFE WAVE SETUPThere is also a bullish wolfe wave setting up on the 4hr and 3D time-frames which all can be used for supporting evidence that a strong rally is nearing. The projected target is calculated by extending a linear line between pivot 1 and 4 and projecting the line. This is represented as the line perforated line, as shown in the chart. If we extend a vertical line from the apex to the perforated target line, the time and price meet on Nov 29, 2022 at 14400. This is a very aggressive time and price target; however, there is a gap open at $13225 and it will most likely fill this year, so I expect the midterm elections along with tax loss selling and christmas rally into january effect will all contribute to a strong rally. I hope the analysis serves you well and you remain on the right side of the market.

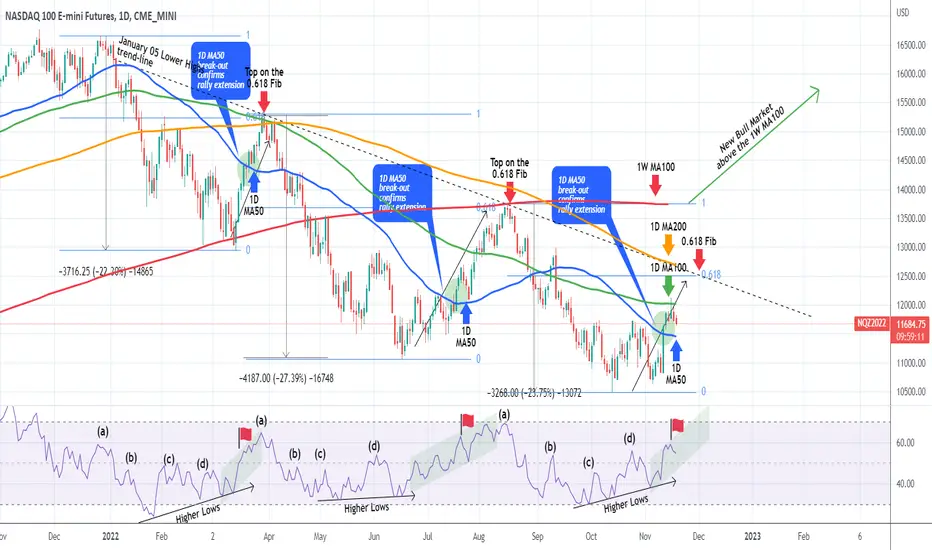
NASDAQ Broke the 1D MA50, targeting 12500.The Nasdaq index (NDX) is making its reversal as following the much lower than expected U.S. CPI report (fell to 7.7% from 8.2% the previous month), it posted the strongest 1 day rise of the year and broke above its 1D MA50 (blue trend-line) for the first time since September 13 (two months). The news that the Fed's approach has started to decrease inflation and the hopes that gives that they may consider easing their rate hike strategy, are fundamentally very bullish for the highly hurt tech sector.
Technically, this 1D MA50 break-out as well as the 1D RSI sequence, is consistent so far with the previous two counter trend rallies in 2022 (March 15 - 29 and June 16 - August 16). Both extended their rallies after breaking their 1D MA50 and topped on the 0.618 Fibonacci retracement level, forming the (dashed) Lower Highs trend-line. The current 0.618 Fib is exactly on the 12500 level.
If that is hit within 7 days, it will make contact with the Lower Highs trend-line as well as the 1D MA200 (orange trend-line), which is intact since April 06. Technically the Resistance level to beat in order to enter a new Bull Cycle is the 1W MA100 (red trend-line), which rejected the August 16 top and has been holding since April 28, being previously the Support of the Bull Run.
-------------------------------------------------------------------------------
** Please LIKE 👍, SUBSCRIBE ✅, SHARE 🙌 and COMMENT ✍ if you enjoy this idea! Also share your ideas and charts in the comments section below! This is best way to keep it relevant, support me, keep the content here free and allow the idea to reach as many people as possible. **
-------------------------------------------------------------------------------
You may also TELL ME 🙋♀️🙋♂️ in the comments section which symbol you want me to analyze next and on which time-frame. The one with the most posts will be published tomorrow! 👏🎁
-------------------------------------------------------------------------------
👇 👇 👇 👇 👇 👇
💸💸💸💸💸💸
👇 👇 👇 👇 👇 👇

Spy October 2022If next week plays out as a broadening wedge bottom, short term bullish into a shoulder, then long term bearish into the holiday kick off

Bear Market Is Over - NDXCharts rarely get cleaner on a high-time frame. 50 day Monthly which has been a long term support is holding, beautiful monthly candle forming, maybe we get a doji. Stoch RSI scraping the bottom, only a matter of time before we trend higher. Not advise.
