NASDAQ Generational Buy Opportunity. The 14 year Channel held.Nasdaq (NDX) is coming off a (near) hit on the 1W MA200 (orange trend-line) last month and the rebound is now closer than ever to test the 1W MA100 (red trend-line) for the first time since April 05, where it was emphatically rejected. This is something that we outlined on our previous NDX analysis that was on the 1D time-frame:
This time we present an analysis based on the 1W time-frame and longer-term parameters as the index not only prepares for this quarterly bullish break-out but with its current monthly rally it holds historic Support levels.
First of all, as the chart shows, the index has been trading upwards (on the log scale) within a 14 year Channel since the 2008/09 Subprime Mortgage (housing) Crisis. As mentioned, it held the 1W MA200 which has never been crossed below since the weekly candle of June 28 2010, but as you see it formed a clear Bullish Cross on the 1W MACD. We've discussed the importance of such crosses in previous posts but for Nasdaq in particular, when that took place around the 0.0 MACD mean (especially from the 2018 volatility period and after), it has been a tremendous buy opportunity, especially when coupled with a break above the 1D MA100.
We can therefore claim that a 1D MA100 break is the last Bullish Confirmation signal on a multi-year scale that validates the start of the near rally within the 14 year Channel, even though some would argue that technically the last Resistance to beat would be the 1W MA50 (blue trend-line)/ 1D MA200 cluster. But for this long-term model, the 1D MA100 seems good enough for a confirmation signal.
For illustration purposes, I've plotted every candle series that after approaching the 1W MA200, broke above the 1D MA100 and (naturally) kick-started a rally (including of course that after the 2009 bottom). It is interesting to see that if repeated, all of them can make an All Time High (before correcting) much above the previous market High, with the exception of the shortest 2019 rally, which would stop just above the previous All Time High.
Note that those are for projection purposes for sure and nothing more as the index may follow a completely different path this time, but interesting as illustrations indeed. Do you think the Channel will hold and guide the price to new ATH?
P.S. As always on long-term log Channels, we've incorporated the -0.236 and 1.236 extremes, which in the case of Nasdaq match almost perfectly the March 2020 (irregular) Black Swan event that broke for just one week below the Channel.
--------------------------------------------------------------------------------------------------------
Please like, subscribe and share your ideas and charts with the community!
--------------------------------------------------------------------------------------------------------
NASDAQ 100 CFD

Daily analysis and trade setups on NASDAQ 20220726NASDAQ is likely to range between Blue zone B & D waiting for FOMC tomorrow.
Macro: Housing price index, consumer confidence, new home sales (all before market open)
Looking for #scalper #trade #setups only
Blue zone B, C, D are in play
Buy
Break: 12375, 12480, 12590
Reversal: 12220, 12100, 12060, 11990, 11800
Sell
Break: 12220, 12130, 12050, 11990, 11920
Reversal: 12370, 12480, 12590, 12670, 12810
Chart with Green Goblins here >>>
Chart with confluence here >>>

NAS100 USD NQ1! NASDAQ 2022 Jul 25 Week
NAS100 USD NQ1! NASDAQ 2022 Jul 25 Week
Last week's long on retracement preference worked well.
Market is now testing previous supply zone.
Temporarily weakness for short opportunity may be expected.
If you see price loitering at the upper end of the rotation range,
there's a potential for a breakout.
Possible scenarios:
1) If market rotates = rotational play strategy, i.e. trade at boundary of range
2) & (3) = Behavior change scenario
Weekly = Ave vol up bar close off high = minor weakness
Daily = Ave vol down bar close off low = minor weakness
+ engulfing bearish reversal candle = S>D
H4: UHV down bar followed by up bar = strength
Price reaction levels:
Short on Test and Reject | Long on Test and Accept
12906 12442
12262 - 11348 rotation zone
11800 11068 10359
<10,000 break of psychology support
Remember to Like and Follow if you find this useful.
Have a profitable trading week ahead.

NDX | Trading at ResistanceNDX 100 is Trading at resistance and the short retracement is possible but seems Bullish in the long term
Note: Trade at your own Risk!

NasdaqI think we are in an ending diagonal within the primary 4th wave position. Inside of the larger intermediate ABC.
LTF daily chart looks like we have lost the lower TL of the ending diagonal in what should become an overthrow on the weekly TF.
Currently working on the Z wave which is the strongest wave of the WXYXZ pattern which usually sends the price up or down depending on whether or not the WXYXZ pattern is bullish or bearish.
After wave Z a strong reversal hits. This is what my chart implies.

Nasdaq100 in the face of a major resistanceNASDAQ100 index is facing a strong resistance around 12,200 (represented in the 50-EMA) after rebounding from the broader weekly downward channel's lower boundary.
A confirmed breakout of the mentioned static resistance, will open the door for further +5.61% bounce (685 points) throughout the week to 12,885 level.

Daily analysis and trade setups on NASDAQ 20220721NASDAQ is likely to consolidate between 12300 and 12700 levels unless PMI data or Friday golden hour breaks one of the sides
Blue level B & C as well as mega level Brown B are in play
Break below 12400 can go as low as 11950
Break above 12650 can go as high as 13060
Buy
Breaks: 12600, 12650, 12710, 12790
Reversals: 12460, 12375, 122215
Sell
Breaks: 12500, 12465, 12350
Reversals: 12700, 12815, 12910, 13030
Chart with Green Goblins here
Chart with confluence zones here

NAS100USD Breakout consolidation zone long tradeNAS100 was trade in consolidation zone /12145~11489/, but it's break on bullish side. it's very good sign to entry long trade.
This is not financial advice. This is for only my private trade plan. If you have follow at your own risk.

Daily analysis and trade setups on NASDAQ 20220721NASDAQ remains bullish above 12300
Buy levels
Reversals: 12390, 12200, 12160, 12040
B/O:
12520, 12590, 12700
Sell levels
Reversals: 12530, 12590, 12670, 12820
B/D:
12370, 12230, 12170
Macro news: Initial jobless claims
Green goblins are in this chart:

Daily analysis and trade setups on NASDAQ 20220720We are in a consolidation zone between 11989 and 12452. Break on either side and continuation will decide the next phase of the trend
Current short term bias is careful bullish
Buy continuation from 12250 for 12485, then 12600 and Blue level B at 12670
Also, buy reversals at 12150, 12915 and 12675
Sell rejections at 12485 or 12600 and, of course, Blue level B at 12670
Also, sell breaks and confirmation below 12200, 12910 and continue holding sales below that
Blue levels B, C, D , E, F in play today
Detailed green level chart is here >>>

Daily analysis and trade setups on NASDAQ 20220719Blue levels C, D, E in play today
#GandalfLine 12230
Buy zones: 11990, 11925, 11680, 11570
Sell zones: 12060, 12100, 12170, 12230

nasdaq update It's ready to down,
Nd100
Sell @ 12150 and 12200
Tp 1 : 11800
Tp 2: 11700
Tp 3: 11500
Tp 4 :11300
Tp 5 : 10800
SL : 12350

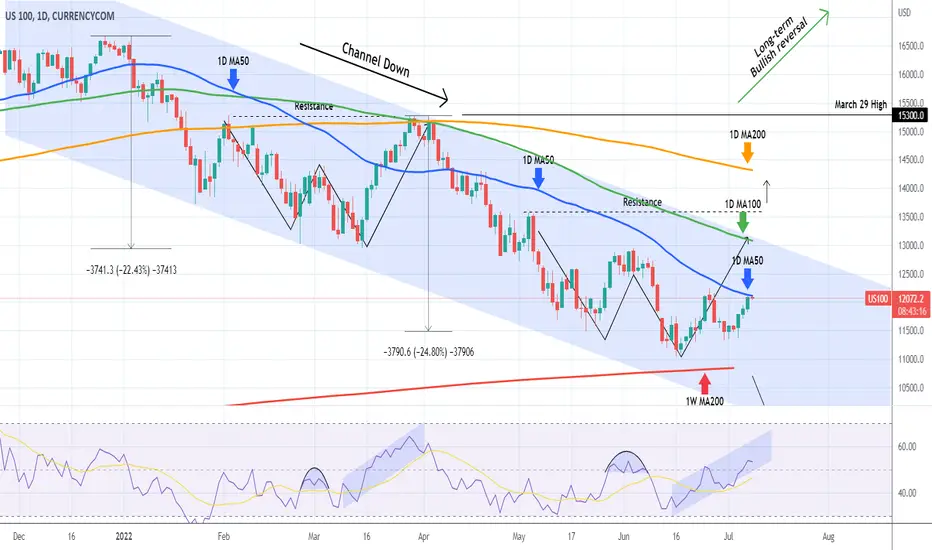
NASDAQ 1W MACD Bullish Cross and 1D MA50 break-outThe Nasdaq (NDX) index is posting today a full 1D candle above the 1D MA50 (blue trend-line) for the first time since April 08. We are still inside the long-term Channel Down formation that started at the beginning of the year but with the 1W MACD making a Bullish Cross for the first time since November 2021, while the price has been on Higher Lows for a full month, there are more probabilities to be seeing the start of a long-term trend reversal.
On the short-term we should approach this in terms of MA break-outs. Right now the first target is the 1D MA100 (green trend-line), which sits naturally at the top of the Channel Down and rejected the price on the last Lower High in April 04.
--------------------------------------------------------------------------------------------------------
** Please support this idea with your likes and comments, it is the best way to keep it relevant and support me. **
--------------------------------------------------------------------------------------------------------

Daily analysis and trade setups on NASDAQ 2022071812200 is #GandalfLine
Blue levels D & C bind the range. Levels B & E provide max limits
Outlook: Careful bullish
Buys above: 12040, 11940, 11900
Sells below: 12190, 12300, 12370, 12400

NAS100 USD NQ1! NASDAQ 2022 Jul 18 Week
NAS100 USD NQ1! NASDAQ 2022 Jul 18 Week
Last week's rotation trading strategy was good // Rotation 11348 - 12262 (900pt range)
There's slight increase in bullish vol and reduction in bearish vol.
Apart from rotation strategy, preference, will be to long on retracement.
Possible scenarios:
1) If market rotates = rotational play strategy, i.e. trade at boundary of range
2) & (3) = Behavior change scenario
Weekly = Ave vol up bar close off high = minor weakness
Daily = Ave vol up bar close at high = minor strength
H4: Very high vol up bar, narrow spread followed by very narrow spread average volume
up bar = weakness
Price reaction levels:
Short on Test and Reject | Long on Test and Accept
12906 12442
12262 - 11348 rotation zone
11800 11068 10359
<10,000 break of psychology support
Remember to Like and Follow if you find this useful.
Have a profitable trading week ahead.

Daily analysis and trade setups on NASDAQ 20220715Blue levels c,d,e,f in play
Buys on confirmed breaks of 11850, 11940 for quick 3:1
Sells on rejection of 12230, 12110, 11920 for max 9:1. Confirmed break of 11760, 11700, 11610, 11500 for max 6:1.
Clean chart with blue levels only >>>

NASDAQHello'' The continuous price is repeating bearish patterns. The price is inside a bearish channel. Expect a drop to the midline of the channel

NAS100 USD NQ1! NASDAQ 2022 Jul 11 Week
NAS100 USD NQ1! NASDAQ 2022 Jul 11 Week
Last week initial boundary for rotation was set 11348 - 12262 (900pt range) when
the minor strength on all 3 TFs manifested in market testing recent high.
I will keep last week's scenario plan in place.
After last week's bullish effort, market may pause and test 11800 / 11348 levels.
Possible scenarios:
1) If market rotates = rotational play strategy, i.e. trade at boundary of range
2) & (3) = Behavior change scenario
Weekly = Ave vol up bar close off high - minor weakness
Daily = Ave vol up bar close off high = level close + narrower spread at higher vol
= weakness
H4: UHV up bar close off high = weakness
Price reaction levels:
Short on Test and Reject | Long on Test and Accept
12906 12442
12262 - 11348 rotation zone
11800 11068 10359
<10,000 break of psychology support
Remember to Like and Follow if you find this useful.
Have a profitable trading week ahead.

NASDAQ hit the 1D MA50, 1st time since April 21.Nasdaq (NDX) hit yesterday its 1D MA50 (blue trend-line) for the first time since April 21 on a near June 27 High test, which is the current Resistance. We are basically expanding on our idea posted 3 weeks ago:
It may have taken a little longer, but the price resumed the rebound it has been making since the June 16 bottom, which is exactly when we posted the buy signal on the index. Technically that made the new Lower Low on the multi-month Channel Down pattern, and this rebound is the sequence towards the Lower Highs (top) trend-line.
The break above the 1D MA50 sets an automatic target on the 1D MA100 (green trend-line), which is where the previous Lower High of March 29 was priced. A break above the Channel Down but more importantly the Resistance level of May 04 (13590), can give us an additional buy signal towards the 1D MA200 (orange trend-line). Notice how the 1D RSI sequences of the past two rebounds are similar.
A 1W candle closing below the 1W MA200 should be enough to kick-start a sharp fall to the 1W MA300 (yellow line, scroll the chart downwards to see).
--------------------------------------------------------------------------------------------------------
** Please support this idea with your likes and comments, it is the best way to keep it relevant and support me. **
--------------------------------------------------------------------------------------------------------
Last month of correction ?But in the Nasdaq monthly chart, there have been 6 months when every new candle is opened, we have a little high and it goes down again... This happened until the two Ichimoku averages cut each other and after that they stabilized.. I think this monthly candle of July will be the same way and we will see the opposite of this situation from the next candle... it will go from the bottom and back of the market.
So, we have to wait at least one more month to see the end of the overall market correction

Last month of nasdaq correction in July The triangle that I included in the previous analysis (contraction triangle) was replaced by a neutral reverse triangle, which was more logical because the post-pattern movement of a contraction triangle should have been a sharp drop, which is really unlikely to happen here. This neutral triangle is weaker and is more suitable for forming the last branch of the correction.

NAS100 USD NQ1! NASDAQ 2022 Jul 04 Week - Use This
NAS100 USD NQ1! NASDAQ 2022 Jul 04 Week
Last week NQ Scenario1+3 played out well for shorts and longs.
- Minor strength displayed on all 3 TFs
- Descending narrowing wedge
??Is the bottom near??
Possible scenarios:
1) If market rotates = rotational play strategy, i.e. trade at boundary of range
2) & (3) = Behavior change scenario
4) <10000 = Devious scenario of hopelessness before market bottoms
Weekly = Ave vol Down off low (and > vol than previous bar) = some minor strength
Daily = Ave vol up bar close at high = minor strength.
H4: Indecisive - Effort no Result for shorts = minor strength
Price reaction levels:
Short on Test and Reject | Long on Test and Accept
12906 12442 11348 11068 10359
<10,000 break of psychology support
Remember to Like and Follow if you find this useful.
Have a profitable trading week ahead.

NAS100 USD NQ1! NASDAQ 2022 Jul 04 Week
NAS100 USD NQ1! NASDAQ 2022 Jul 04 Week
Last week NQ Scenario1+3 played out well for shorts and longs.
- Minor strength displayed on all 3 TFs
- Descending narrowing wedge
??Is the bottom near??
Possible scenarios:
1) If market rotates = rotational play strategy, i.e. trade at boundary of range
2) & (3) = Behavior change scenario
4) <10000 = Devious scenario of hopelessness before market bottoms
Weekly = Ave vol Down off low (and > vol than previous bar) = some minor strength
Daily = Ave vol up bar close at high = minor strength.
H4: Indecisive - Effort no Result for shorts = minor strength
Price reaction levels:
Short on Test and Reject | Long on Test and Accept
12906 12442 11348 11068 10359
<10,000 break of psychology support
Remember to Like and Follow if you find this useful.
Have a profitable trading week ahead.
