Ndx: Watch Hour Opening Firstly, I just want to congratulate everyone who made it to this year. I pray for success and positivity for y'all.
Nasdaq100 has been on a roll for a while now... The indecision between the bulls and bears have made me to just wait at the sidelines.
My edge hasn't fully played out so---I'm not about to force things.
In this video, I explain all that should be done.
Be sure to watch the whole clip, like, comment and follow me. I appreciate all your contributions to my work.
Happy a great week!
Lazyluchi.
NASDAQ 100 CFD

Nasdaq Analysis 03.01.2022Hello Traders,
welcome to this free and educational analysis.
I am going to explain where I think this asset is going to go over the next few days and weeks and where I would look for trading opportunities.
If you have any questions or suggestions which asset I should analyse tomorrow, please leave a comment below.
I will personally reply to every single comment!
If you enjoyed this analysis, I would definitely appreciate it, if you smash that like button and maybe consider following my channel.
Thank you for watching and I will see you tomorrow!

US100 update guys as you can see here im seeing that nasdaq didnt yet tought the bottom of the channel, and also looking at the COT data the big biys are putting on great selling preasure and also if u go on the weekly timeframe u gon see that the last candlestick is giving us that unique candle that closed in a beautiful manner and also when u look at this line chart resistance was broken but now prices came back and closed within the consolidation range , always remember that the close of a candlestic is more importandt then the movement , but nobody is perfact, its just an idea n i hope it helps u out ,, thank you,

NAS100 USD NQ1! NASDAQ 2022 JAN 03NAS100 USD NQ1! NASDAQ 2022 JAN 03
Happy New Year and have a prosperous 2022!
Trade levels 15540 / 15650 given on 2021 Dec 20
with market targeting 16460 was achieved.
Rotation range remains: 16767 - 15540.
Weekly/Daily = Price did not reach supply line of trend channel,
possible pullback to demand line.
Intraday short will be preferred as long as price within brown
downward channel.
Weekly: Uptrend channel. Low volume upthrust bar
(2nd UT) near reference high 16767.50 =
Weakness.
Daily = Uptrend channel. Ave volume UT bar followed
by weakness (2nd UT after reference high)
H4:High volume down bar closing off low.
Short preferred on retracement for intrady.
17441 17070
16767 16660
16458 16336
16140 15925
15538 15492
15000 14892
Short on Test and Reject | Long on Test and Accept
Remember to Like and Follow if you find this useful.
Have a profitable trading week ahead.

Nasdaq Long Term PredictionNasdaq Monthly Prediction, Bearish market to start by end of February.
Before the bearish market we have a gap to go up to 17700.
This my personal point of view, not to be considered as trading advice or strategy.

QQQ notes1. Weekly RSI divergences did indicate a bounce and suggested a weekly close at 399.79. We ended up with a open at the bottom of our weekly candle and a close near the open, very negative.
2. QQQ didn’t tag the 90% Fibonacci retrace nor did the index.
3. Price is above the 20 day and rising.
4. I did add a possible i ii
5. No clear trend

Ndx: Last Days Of DecemberHow was your December/year?
In this video, I explain how the bulls and bears are now in a range. It's advised to stay out as we watch the watch-hour close. Be available every Saturdays for my teaching.
Happy new year!
Listen, trading is risky and not easy. Be sure to not trust anyone---even me!
Please leave a comment, like and follow-up if you enjoy my feeds or not. Haha! still follow me either way.

Ndx Explained: Must Watch!Hey guys! I'm so sorry. Been extra busy should have updated y’all about the “ignored” bearish divergence.
The pulls weren’t done yet.
My apologies but, then again don’t trust me, don’t trust anyone but yourself. 🙏🏾
If something doesn’t feel right, it just isn’t.
So, all I explained the steps you need to take in the video... Be sure to watch all of it.
Listen, trading is risky and not easy. Be sure to not trust anyone---even me!
Please leave a comment, like and follow-up if you enjoy my feeds or not. Haha! still follow me either way.

Ndx: Wait For The PullsHappy anniversary to me!
It's been a year since I decided it's Nasdaq and nasdaq100 only.
Trading this guy consistently for a year has been a blast.
Thank you all...
Erm, took a hilarious trade by 2am today. Wasn't a bad one though just hilarious Cos', it was a terrible risk to reward although my target was 16700. Took partials and left I just felt like I needed an excuse to close it though---Cos' I wasn't comfortable with the risk.
I'm having a deeper throat now-a days.
Anyway, my bias from yesterday still stands. We still need the bulls to be stronger. The "W" is almost completed and all I say we do now is, Wait.
Explained reason in the video, be sure to watch it.
Target---16771
Listen, trading is risky and not easy. Be sure to not trust anyone---even me!
Please leave a comment, like and follow-up if you enjoy my feeds or not. Haha! still follow me either way.

Ndx Watch Hour.. The Bulls Broke ItHappy new year guys. I'm saying "happy new year" cos'---my trade week has ended I'm just having fun with the remaining days left. Till we scream 2022!
Anyway, the bulls finally broke the barrier that was created since November 25th.
I feel like they actually didn't stand a chance Cos', I mean "the festive period" was kind of positive.
Spoke about future bull plans in the video so, I highly recommend you watch it.
If you loved it, do make sure to leave a like, comment and a follow-up.
I appreciate everyone of you!
L.luchi

NDX Nasdaq 100 Santa Rally?The Santa Rally is set to start on Monday, Dec. 27.
This period gave positive return for the S&P 500 78.9% of the time.
Since 1950, the average return of the Santa rally was 1.33%.
How do you think this will be reflected in the Nasdaq 100 index?
The reasons could be optimism over the new year ahead or holiday spending.

Ndx Watch Hour.. Will The Bulls Make ItHappy holidays nasdaq100, ndx, and nq_f lovers. I think we can all agree that the bulls are really trying to have a great comeback.
It's been a month since the bears created their wall 25 of November to be precise. The question is are the bulls going to finally break it?
Watch the clip to get the tea.
Trading is fun and risky stay safe.

Longer triangle? QQQ may need more time for a break out. FVE indicator is by Markos Katsanos. mkatsanos.com

Nasdaq100 Bulls Are Approaching The Bears AgainAlright y'all know our december has been a back n' forth battle with the bears...
The barrier created by these bears hasn't been exceeded yet.
For reasons best known to them.
But, with all the signs they've created. They might just get it right this time.
Watch the clip to get the tea.
Trading is risky, stay safe..

Nasdaq100 Bulls Have A MessageSo as the bulls messenger, I brought to you an important news by---nasdaq100 today.
Which I said in my video.
Kindly watch the clip to get the information, as it would be highly useful to you today.
Trading is risky and those cash don't always come back.
Cheers,
lazyluchi.

NDX - SHS Downward Trend will accelarateEveryone is talking about this for weeks now. Charts and patterns start to form.
Non-super large caps and non large caps of NDX is already down %30 - %40 since Feb 21 ATH. They did their correction.
However FAANG and so on kept NDX stable. Bells are chimming for them now and they will go down at least 15-20%.
Not an investment advice.

NASDAQ LONG SHORTWatch how the market will respect this zones in order for it to establish its stance for the day.

US TECH100 long ideaus tech100 or NASDAQ is standing at strong demand zone plus it going to be a double bottom so i am bullish biased.

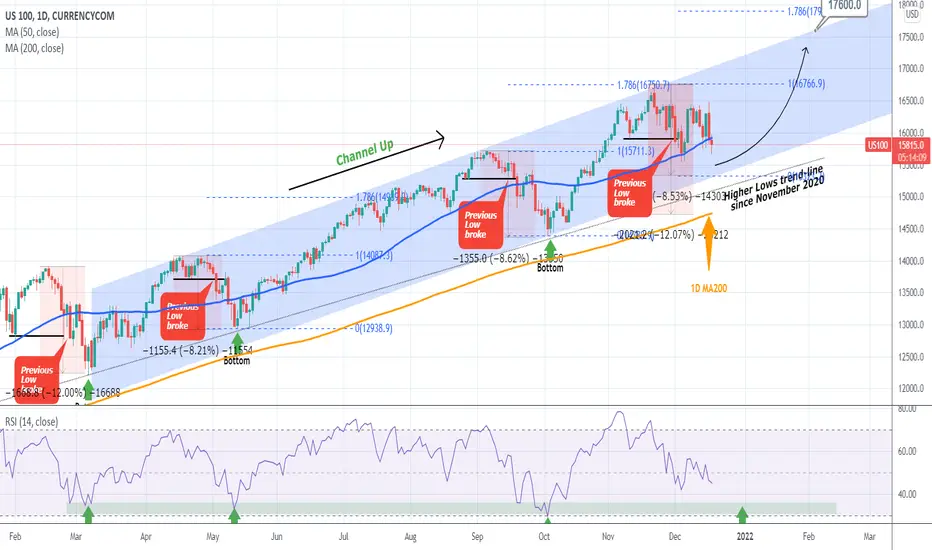
NASDAQ One last low is possible before new ATHNasdaq has been particularly week this month as yesterday's rejection saw the price back to the 1D MA50 (blue trend-line) again and near the December 03 low. We do remain inside a year-long Channel Up but the very structure of this pattern allows for one final Lower Low before making a bottom.
As you see on the chart, every time NDX broke the last Low of the previous uptrend (bold black line), the price dropped either around -8.50% or -12.00%, while the RSI bottomed within the 35.000 - 30.000 Support Zone. Neither of that has happened yet and technically when either of those happens first, then that would be a good estimate for a bottom on Nasdaq.
A -8.50% pull-back from the top would place the price at around 15,350 while a -12.00% at around 14,750. The latter however would mean a break below both the Channel Up and the Higher Lows trend-line that is holding since November 02 2020, while at the same time making a direct hit on the 1D MA200 (orange trend-line). Thus I consider it far less likely. For a long-term trader, even the fact that we are currently around the 1D MA50, translates into a good buy opportunity.
Our Target on a 1.5 - 2.0 months horizon is 17600 which is slightly below the 1.786 Fibonacci extension, a standard target for NDX after such a bottom.
--------------------------------------------------------------------------------------------------------
** Please support this idea with your likes and comments, it is the best way to keep it relevant and support me. **
--------------------------------------------------------------------------------------------------------
Nasdaq 100 still bearish in wave (4)Working a WXY to finalize end of year 2021
Next year an impulsive move towards 18k and more is expected

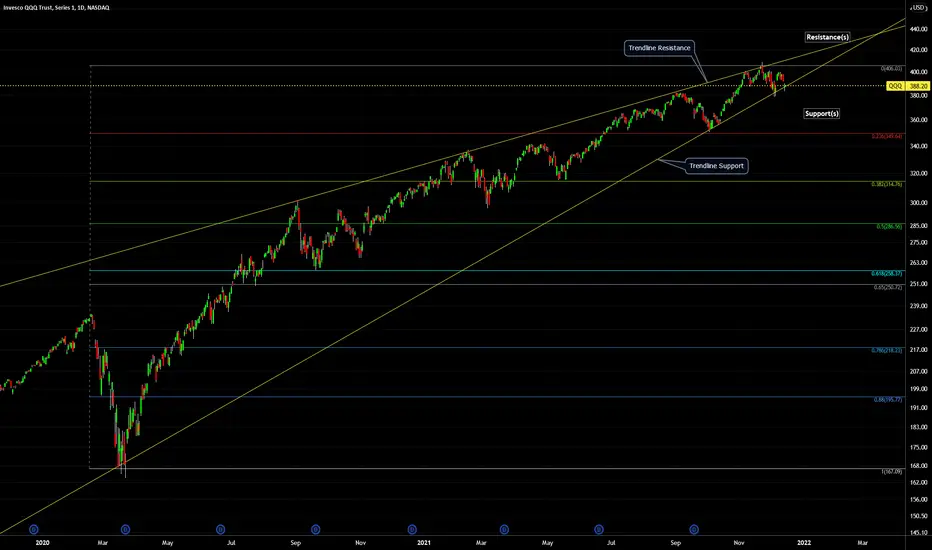
QQQ (Nasdaq ETF) - Support, Resistance, Trendlines, Pattern 2021QQQ (Nasdaq ETF) - Support, Resistance, Trendlines - 2021- Daily:
Price Pattern: potential Head-and-Shoulders.
-Resistance Price Levels (colored horizontal lines above current price)
-Support Price Levels (colored horizontal lines below current price)
-Trendline Resistance (diagonal yellow lines above current price)
-Trendline Support (diagonal yellow lines below current price)
note: chart is on log scale.
Bonds Vs BTC and Equities What does everyone think about this?
This is the conclusion forecast of all the previous ideas I've been working up to
I don't see many people talking about the bigger picture of what is actually happening with Smart Money VS Retail
TNX and BTC show the correlation
TLT and the NDX show a similar but opposite correlation
Bonds lead then Risk assets follow accordingly
Wouldnt this make sense fundamentally?
BTC Is a hedge against inflation so it copies the 10-year bond outpacing inflation
Equities especially growth stocks are not a hedge to inflation so they have an opposite correlation to what interest rates are doing
I think something big is going to happen and a lot of people will get shaken out.
You can see the big fear narratives all stacking up before the new year!
The whales have been trick or treating this holiday season and I think this X mas rally was a big trick for all the retail shrimp to get caught in the feasting season.

NDXNasdaq looks like it still has the ABC down happening, the SP500 looks like it want's to push higher, while the nasadq looks like a H&S pattern can play out dropping tech stocks to 14,000 to finish wave C. I really don't like the mixed indices. When DJIA was pointing down for wave 4 but SP500 & NASDAQ were pointing up the truth was revealed that the dow jones w4 bears had the power to correct all markets. So we need to watch closely. The Evergrand news seems to be priced in though, so let's see if the bulls can NUKE the head & shoulders pattern and break out above ATH. I would add the a big crash to 14k would likely be the gas needed to pump NDX over ATH(just a thought)
