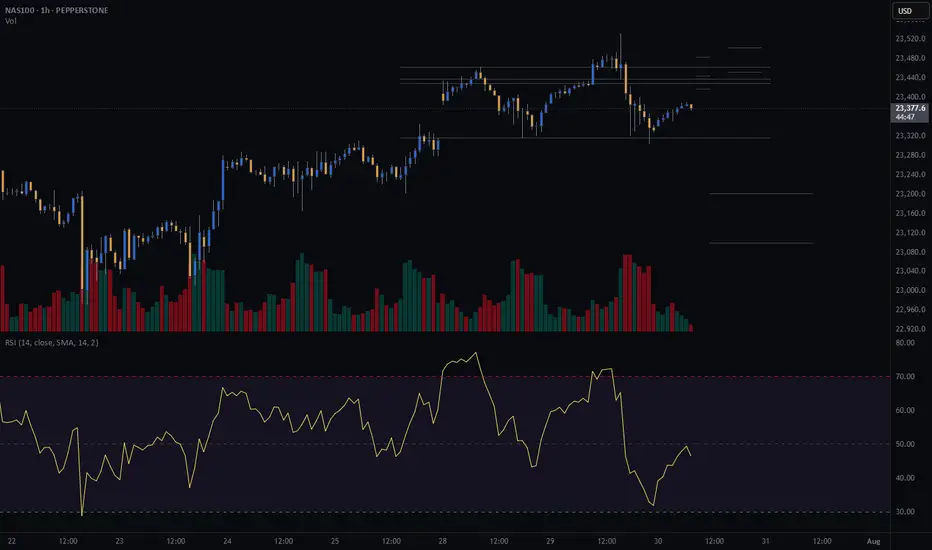
CASH100 (NASDAQ) CRASH - Head and shoulders Risk/reward = 3.7
Entry price = 23 430
Stop loss price = 23 503.2
Take profit level 1 (50%) = 23 202
Take profit level 2 (50%) = 23 099
Still waiting for some variables to confirm before entering the trade
Ndxtrading
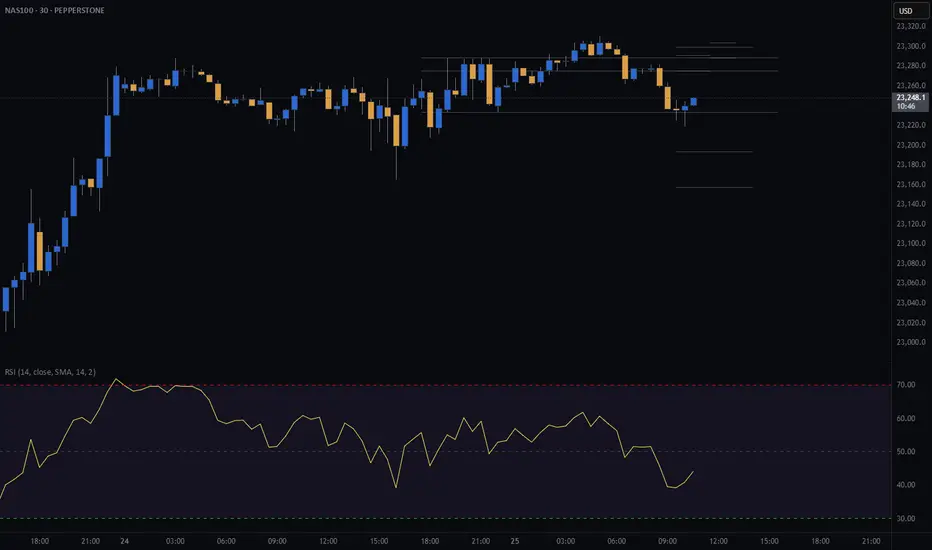
NDX (NASDAQ) CASH500 SHORT - Head and shoulders 30minRisk/reward = 3.2
Entry price = 23 275.7
Stop loss price = 23 303.9
Take profit level 1 (50%) = 23 193
Take profit level 2 (50%) = 23 157
Waiting on confirmation on a number of variables before entering the trade.
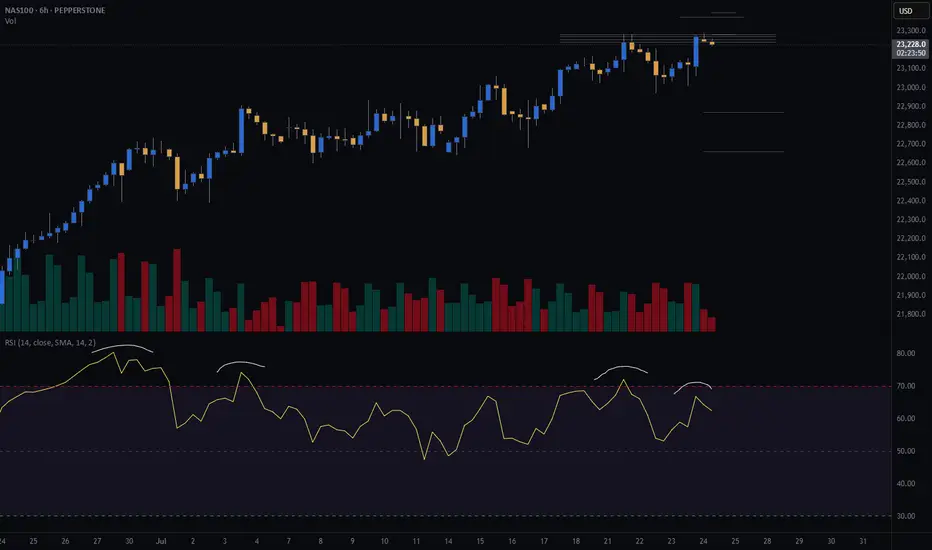
NASDAQ (CASH100) SHORT - double top H6Risk/reward = 4.3
Entry price = 23 282
Stop loss price = 23 398
Take profit level 1 (50%) = 22 871
Take profit level 2 (50%) = 22 663
If current H6 goes back into range, I will open short position.
All variables on checklist have been met.
I was out last night so I missed my initial entry. Hoping for a second chance.
Hopefully this short works because the last few higher time frame short setups have failed, although because of exit plan I have made very little losses.
NASDAQ (CASH100) SHORT - Head and shoulders H1Risk/reward = 3.8
Entry price = 23 167.9
Stop loss price = 23 232.8
Take profit level 1 (50%) = 22 943
Take profit level 2 (50%) = 22 878
Still waiting on confirmation on some variables in checklist

NAS100 (CASH100) SHORT - head and shoulders 30minRisk/reward = 3.9
Entry price = 23 137.9
Stop loss price = 23 153.9
Take profit level 1 (50%) = 23 071
Take profit level 2 (50%) = 23 060
Still need to validate a few variables.
Lets goooooo

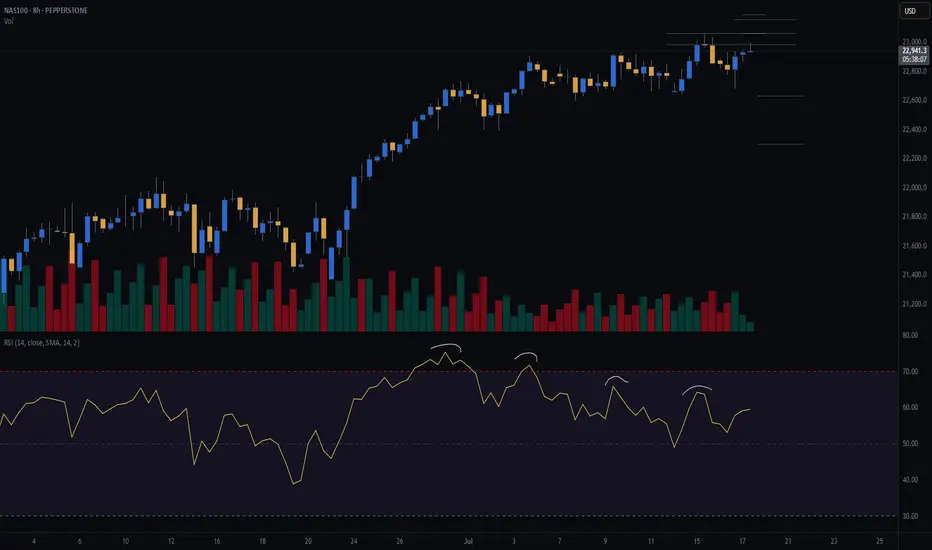
NAS100 (CASH100) SHORT - Double Top H8Risk/reward = 4.6
Entry price = 23 063
Stop loss price = 23 190
Take profit level 1 (50%) = 22 635
Take profit level 2 (50%) = 22 303
Still waiting for confirmation on some variables.
For example, need H8 candle to close in range and volume to validate, amongst other variables.
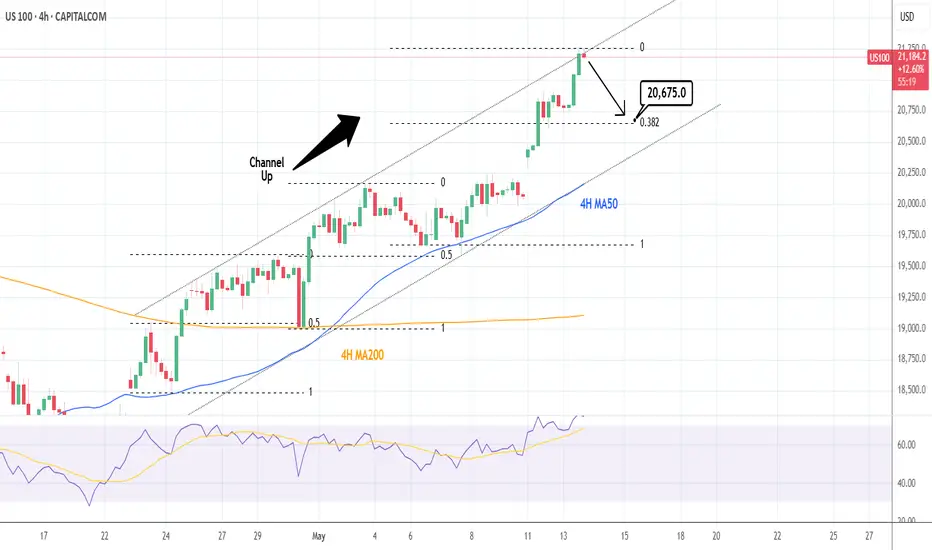
NASDAQ: Time for a 4H technical correction.Nasdaq is almost overbought on its 1D technical outlook (RSI = 69.775, MACD = 371.830, ADX = 37.524) and has reached the top of its 4H Channel Up. The two HH that the pattern has both pulled back to the 0.5 Fibonacci retracement level before the 4H MA50 provided the necessary support for the next bullish wave. Consequently we expect a small correction to at least the 0.382 Fib next (TP = 20,675).
See how our prior idea has worked out:
## If you like our free content follow our profile to get more daily ideas. ##
## Comments and likes are greatly appreciated. ##
NASDAQ: 50% probability that this Golden Cross is bearish.Nasdaq is bullish on its 1D technical outlook (RSI = 60.920, MACD = 61.810, ADX = 33.031) as it continues its recovery from the Low of the previous month. In the meantime, it formed a 4H Golden Cross, the first since January 23rd. Even though this is a bullish pattern theoretically, it often doesn't deliver an immediate rise. More specifically, since the October 2022 market bottom, Nasdaq has had another 10 Golden Crosses on the 4H timeframe. The interesting statistic is that 5 have extended their rallies but the other 5 cuased a pullback (short or medium term). Consequently we call for caution in the next 2 weeks, as the market may correct towards the 4H MA200 before it resumes the long term uptrend.
## If you like our free content follow our profile to get more daily ideas. ##
## Comments and likes are greatly appreciated. ##

NASDAQ: Rejected on the 1D MA50. Can it break it?Nasdaq is neutral on its 1D technical outlook (RSI = 52.608, MACD = -100.810, ADX = 23.609) as it got rejected today on the 1D MA50. That is the first serious Resistance test of the April 7th rebound and until it breaks, we can see a technical pullback to the 4H MA100 in order to establish the new Support. With the 1D RSI confirmed the new long term bottom with a DB, buying the dips on every such pullback is the most effective strategy on such occasions. Our short term target is the R1 level (TP = 20,300).
## If you like our free content follow our profile to get more daily ideas. ##
## Comments and likes are greatly appreciated. ##

NASDAQ: Broke into the 2 year Support Zone.Nasdaq has turned bearish on its 1D technical outlook (RSI = 41/199, MACD = -42.030, ADX = 30.270) as the correction that started last Thursday hit the 1D MA100. The region between the 1D MA100 and 1D MA200 is the index's 2year Support Zone and has been a buy opportunity since February 2023. With the 1D RSI also on 6month lows, the current level is low enough to be a HL on the long term Channel Up, after which rallies to the 3.5 Fibonacci extension have started. Go long, TP = 24,000.
## If you like our free content follow our profile to get more daily ideas. ##
## Comments and likes are greatly appreciated. ##

NASDAQ: Perfect neutral setup for scalp buy.Nasdaq is neutral on its 1D technical outlook (RSI = 52.467, MACD = 38.030, ADX = 17.154) since the index has been consolidating for the past 6 weeks. This offers great opportunities to buy low and sell high. At the moment the 1H RSI oversold bounce indicates that we has started a similar Channel Up so Jan 13th and Jan 27th. The symmetric RSI level suggests that this is where the index pulls back to retest the 1H MA50 and then rebounds for a new HH. On the medium term we are limited by the R1 Zone, so aim for its bottom (TP = 21,845).
## If you like our free content follow our profile to get more daily ideas. ##
## Comments and likes are greatly appreciated. ##

NASDAQ: Critical breakout ahead that can send it to 22kNasdaq is almost overbought on the lower time-frames but just turned bullish on 1D (RSI = 55.402, MACD = -62.050, ADX = 25.952) and the main reason is that it closed over the 1D MA50 yesterday. This can't be considered a bullish signal on its own as the LH trendline is right over it and is being tested today. If broken, it is very likely to see the next bullish wave of the Channel Up. The previous two waves confirmed the uptrend after a candle closed over the LH.
If that happens, we will aim for a new Channel Up HH at the end of the year, almost at +31% from the bottom (TP = 22,000) like March's High.
See how our prior idea has worked out:
## If you like our free content follow our profile to get more daily ideas. ##
## Comments and likes are greatly appreciated. ##

NDX / NAS100 long idea 17780 point is the point to be protected and the stop point. I still think bullish, target point 18400. long position can be taken with bullish confirmations or long can be taken from the region above 17300.

NASDAQ: Channel Up peaked. Correction needed.Nasdaq is forming a new HH at the top of the 1 year Channel Up with the 1W timeframe overbought technically (RSI = 70.596, MACD = 766.660, ADX = 46.154) and the RSI in particular under LH and inside the red Resistance Zone. This is a bearish signal, validation would come upon a 1D MA50 bearish crossing. Our target is the 1D MA100 (TP = 16,850).
## If you like our free content follow our profile to get more daily ideas. ##
## Comments and likes are greatly appreciated. ##

NASDAQ: Channel Up soon to test the ATH.Nasdaq is almost overbought again on the 1D technical outlook (RSI = 69.937, MACD = 245.100, ADX = 36.889) but that shouldn't affect it much as it is trading on the lower band of the November Channel Up. Leg 1 of the bullish sequence that made the Nov 15th HH extended to the 2.382 Fibonacci level. As the 1D RSI is identical to that Leg and shows that we are roughly halfway there, we remain bullish aiming again at the 2.382 Fib extension (TP = 16,840) which is marginally over the All Time High of 16,780.
## If you like our free content follow our profile to get more daily ideas. ##
## Comments and likes are greatly appreciated. ##

NASDAQ: Short term sell opportunity.Nasdaq hit our TP = 15,000 as since our last idea (chart at the bottom) we took full advantage of the whole LH leg of the Channel Down. With the 1D technical outlook now just slightly bullish (RSI = 56.567, MACD = -24.590, ADX = 32.703) despite the seven day rally, we are looking towards a short term pullback that will test the buying strength and investor commitment towards a long term rise.
Consequently we are going short here, on the RSI rejection on R1, targeting the 0.382 Fibonacci retracement level (TP = 14,750).
See how well our prior idea has worked:
## If you like our free content follow our profile to get more daily ideas. ##
## Comments and likes are greatly appreciated. ##

SQQQ's Steep Drop From Yellow Sell ZoneIn my previous update I emphasized that this yellow sell zone is a very strong resistance level for SQQQ. There was a lot of uncertainty surrounding the Friday jobs data, but the data came in very strong and almost double expectations. This led to a bullish rally for TVC:NDQ and SP:SPX that led to steep bleeding for SQQQ. I predicted that SQQQ will drop below the green support level over the next few months, these are my updated price targets on the way down.

NASDAQ: Below the 1D MA100 after 8 months! Attention needed.Nasdaq crossed under the 1D MA100 today for the first time since January 20th (exactly eight months) with the 1D technicals turning bearish (RSI = 38.504, MACD = -53.900, ADX = 32.187). Following a much more hawkish than expected Fed yesterday, the market is taking this opportunity to take profits on a relief pull-back after what was basically a non-stop rise throughout the year.
From a purely technical perspective, the pattern that has the most probabilities to emerge is a Channel Down. Assuming a perfect symmetry on its LL legs, we expect the current wave to be the bearish leg that will take it on a -8.72% decline to the bottom of the Channel Down. We will sell as long as today's candle closes under the 1D MA100 and target a little over S2 (TP = 14,300).
## If you like our free content follow our profile to get more daily ideas. ##
## Comments and likes are greatly appreciated. ##

NASDAQ Moving Lower (1W)NASDAQ Weekly
Price Chart
After forming a double bottom in late 2022 the NASDAQ bounced and has melted up from its lows approximately 48% confirming that it was more than just a bear market rally. Most recently the NASDAQ has run into resistance (Light Red Box) and has descended roughly 3% past a minor trend line on the daily chart (not shown). Shorter term EMA's are beginning to even out (12-day / 26-day) indicting the beginning of a change in the direction of price action which will most likely move lower towards the target supports (Light Green Boxes). If the bottom support (Red Solid) is broken (pretty big "if" at the moment) then the possibility of breaking the long-term trend line (Yellow Solid) will come into play, however at this point it is premature to assume this comes to fruition.
Relative Strength Indicator
The major trend line (Yellow Solid) highlights the divergence from price action beginning in May 2022 and confirming the double bottom ending in December 2022. Most recently the RSI has remained elevated above the 70 line indicating a strong trend, however, the RSI has fallen back below the 70 signaling weakness. The RSI most likely moves down toward the major trend line and major support (Red Solid) from this point. Considering a cradle is in play with the resistance and trend line crossing, it will more than likely bounce with price action allowing the price to attempt one more move higher but will ultimately fail along with RSI failing to make a higher high and confirming price action. If the support and trend are broken it is most likely game over.
On Balance Volume
OBV bounced along with price and RSI in December 2022 and continued higher while making two consecutive bull flags confirming the movement. The OBV has failed to move higher after encountering resistance (Aquamarine Dotted) while retesting the major trend line (Yellow Solid) and seemingly has begun to move lower (emphasis on begun to). It is also notable to mention that a minor trend line (Yellow Dotted) has created a cradle that the OBV has so far failed to break. If the major resistance (Red Solid) is broken then it is basically game over, but we have two areas of support (Light Green Boxes) that will need to be broken first. The major resistance has had previous breaks which led to major downturns that can be seen in December 2000, February 2005, and September 2008 (all shown above).
TDLR;
Just want the meat and potatoes huh? Don't worry our entrees always Seem Legit. Price action recently hit resistance and has begun to move lower while EMA's begin to flatten. There's a 3% move down from a minor trend line on the 1D (not shown). The RSI is showing a bearish divergence after remaining elevated over the 70 line and beginning to move lower. The OBV looks to be forming a double top, and has run into resistance from a major and a minor trend line. Don't forget that this could take months to play out since this is the weekly chart.
What Seems Legit?
Possibly a bounce here from the support formed Jan - Mar 2022 in conjunction with the 12-day or 26-day EMA, retest the recent high, fail to break it and begin to move lower. It might just push lower due to the RSI on the 1D moving below the 50 line (analysis of the 1D has been posted).
"History doesnt repeat itself but often it rhymes" -
- Tap the 50-day EMA and carry on (2019)
- Crash to the major trend line and carry on (2020)
- Break the major support on the OBV and head lower (2000, 2005, 2008)
Chart Key
Yellow Solid = Major Trend Line
Red Solid = Major Support
Aquamarine Solid = Divergences
Red Box = Major Resistance
Green Boxes = Supports / Target Areas

NASDAQ: Hasn't yet completed its technical pullback.Nasdaq has been pulling back since the June 16th High, which was a HH on the Channel Up pattern, but this sequence isn't yet completed. The 1D time frame remains technically bullish (RSI = 62.049, MACD = 275.090, ADX = 32.676) but the price hasn't yet reached neither the bottom of the Channel Up nor the 4H MA50.
We remain short targeting that level (TP = 14,600) where we will turn bullish again (TP = 15,250) unless the 1D candle closes under the 4H MA50, in which scenario we will re-sell and target the 1D MA50 (TP = 14,300).
The 1D RSI however made a hit and rebound on the HL trendline that is in effect since December 28th 2022, so it is possible to see a rebound without going lower, so in that case only buy after the R1 breaks and target the R2 (16,000).
Prior idea:
## If you like our free content follow our profile to get more daily ideas. ##
## Comments and likes are greatly appreciated. ##

NASDAQ: Correction aiming at the 4H MA200.Nasdaq reached the R1 (15,300) last week, a highly important benchmark as it is the March 2022 Top. Being overbought on the 1D timeframe (RSI = 71.117, MACD = 398.240, ADX = 42.100), the current correction comes as a natural consequence. The target is the bottom of the three month Channel Up. Ideally we aim at the 4H MA200 (TP = 14,600), which has been previously tested and held as Support on May 4th and April 25th.
Prior idea:
## If you like our free content follow our profile to get more daily ideas. ##
## Comments and likes are greatly appreciated. ##

NASDAQ Rejection on March 2022 High gives a strong sell signalNasdaq got rejected exactly upon touching the 15285 Resistance for the first time since the High of March 29th 2022.
This is a strong sell signal and can be confirmed after the RSI (1d) crosses under the MA line.
The long term pattern is a Channel Up since the beginning of March and the MA50 (1d) has been intact since March 15th, which makes the index exceedingly overbought.
Trading Plan:
1. Sell after the RSI (1d) crosses under the MA (white line).
Targets:
1. 14300 (Channel Up bottom and near Support 1).
2. Extend to 13520 only if we close a (1d) candle under the MA50 (1d).
Tips:
1. The RSI (1d) is printing a pattern similar to the tops of February 2nd and March 31st. Both reached the 1.618 Fibonacci level, which was our target on our last Nasdaq call (see chart below).
2. If we do break below the MA50 (1d), the MA100 (1d) could be a valid target as it has been untouched since January 20th.
Please like, follow and comment!!
Notes:
Past trading plan:

NASDAQ The weekly charts tells you what you need to knowNasdaq / US100 is approaching today Resistance A (15280), which is the High of March 2022.
The pace of the rally since the start of the year has been so strong, in fact since the week of April 24th the index has posted only green weekly candles (8 today), that the 1week RSI reached a level (76.75) it last hit almost 2 years ago (on August 24th 2020).
In the last 6 years, every time the 1week RSI hit that level, Nasdaq made a top and corrected either immediately or in a few weeks.
On all those times, there was a clear Support Zone for the RSI to place your buys (47.90 - 52.90).
Also on all cases the price corrected to at least the 1day MA50.
This isn't primarily an invitation to sell what is obviously a bullish trend but rather take some profit of the index (or shares) in order to lay off some risk and enter again at a better price as suggested by the 1week RSI and the 1day MA50.
Our long term target is the 16840 All Time High (Resistance B) by December.
Previous chart:
Follow us, like the idea and leave a comment below!!
