The key is whether it can rise above 2.24Hello traders!
If you "Follow" us, you can always get new information quickly.
Please also click “Boost”.
Have a good day.
-------------------------------------
(NEARUSDT chart)
Among the coins that are expanding the coin ecosystem, NEAR is one of the coins that has not yet risen above the MS-Signal indicator on the 1M chart.
Accordingly, the key is whether the price can be maintained above 1.99 and rise above the M-Signal indicator on the 1M chart.
(1W chart)
To do so, it is necessary to check whether the price can be maintained by rising above 2.24.
If that happens, it is expected to lead to a movement to rise above the M-Signal indicator of the 1M chart and an attempt to break through the MS-Signal indicator of the 1M chart.
(1D chart)
The key is whether the price can be maintained by receiving support around the 1.870-1.964 range and rising above 2.272.
Accordingly, it is becoming important whether the price can be supported by rising to the box range of 2.086-2.404.
--------------------------------------------------
- The big picture
The full-fledged upward trend is expected to begin when the price rises above 29K.
This is the section expected to be touched in the next bull market, 81K-95K.
-------------------------------------------------- -------------------------------------------
** All explanations are for reference only and do not guarantee profit or loss in investment.
** Trading volume is displayed as a candle body based on 10EMA.
How to display (in order from darkest to darkest)
More than 3 times the trading volume of 10EMA > 2.5 times > 2.0 times > 1.25 times > Trading volume below 10EMA
** Even if you know other people’s know-how, it takes a considerable amount of time to make it your own.
** This chart was created using my know-how.
---------------------------------
Nearprotocol

I expect NEAR to rise to $2.12Hello everyone! I have a great idea regarding NEAR.
With the recent upward movement, NEAR has broken out of the accumulation zone, surpassing the first major resistance level, as well as the nearest strong Fibonacci level of 0.236 and the 200-day moving average (EMA 200).
Currently, the asset is within another range of resistance/support, and in a bullish market, it should easily overcome this level.
I believe that the asset is currently in a good range for buying opportunities.
On the chart, the blue horizontal lines indicate other areas of resistance/support for the price.
My final target is a growth up to the 0.618 Fibonacci level, which would bring a profit of 41%.
I also see the possibility of further upward movement towards $2.4 and $2.7.
All targets are shown on the chart.
Please note that this is not financial advice, and any actions you take are at your own risk!

NEAR Falling Wedge Retest : $2.8 targetExciting developments are unfolding in the world of crypto, and NEAR Protocol (NEAR) has caught our attention. It recently broke out of a falling wedge pattern, and the current setup presents a golden opportunity for those keeping a close eye on this dynamic project. Let's explore the breakout and the potential rewards it might offer. 📈💎
Breaking Out of the Falling Wedge:
NEAR has recently made a significant move by breaking out of a falling wedge pattern. This pattern is often a bullish signal, indicating a potential reversal or upward continuation.
The Retest Scenario:
Following the breakout, NEAR is currently in the process of retesting the wedge's upper boundary on the daily timeframe. This retest could act as confirmation of the breakout and provide an entry point for traders.
Risk-Reward Ratio: 1:7?
For those considering a position in NEAR, the risk-reward ratio appears to be favorable. Depending on your risk tolerance, entering now during the retest could potentially yield a risk-reward ratio of 1:7.
Trading Strategy:
Observation: Monitor NEAR's price action during the retest phase, paying attention to signs of confirmation.
Risk Management: Implement a robust risk management strategy, considering the volatility of the crypto market.
Entry Point: If the retest confirms the breakout, consider entering a position, keeping in mind your desired risk-reward ratio.
Conclusion:
NEAR's breakout from the falling wedge presents a compelling opportunity for traders. However, it's crucial to approach the market with caution and ensure that your trading strategy aligns with your risk tolerance.
As you navigate this potential trade, may your analysis be sound, and your trades lead to success.
❗️Get my 3 crypto trading indicators for FREE! Link below🔑

NEAR / NEARUSDTGood Luck >>
• Warning •
Any deal I share does not mean that I am forcing you to enter into it, you enter in with your full risk, because I'll not gain any profits with you in the end.
The risk management of the position must comply with the stop loss.
(I am not sharing financial or investment advice, you should do your own research for your money.)

NEAR updateAMEX:NEAR update...
First attempt failed, this is my second attempt... If this trade is also stopped I'll wait for confirmations around ~1,55...
Be safe...
#trading
@NEARProtocol
#Near #NEARProtocol #altcoins

📈 NEAR Falling Wedge Breakout ! Prepare to be amazed by Near Protocol's recent price action, which has unveiled a masterpiece in the world of chart patterns – a massive falling wedge. As this wedge pattern developed right above a significant support zone, the subsequent breakout couldn't be more bullish, setting the stage for exciting potential price movements. 📐🚀
Unwrapping the Falling Wedge
The falling wedge is a remarkable chart pattern in which the price forms a series of lower highs and lower lows, converging within two trendlines that slant in the same downward direction. This pattern typically signals a bullish reversal, hinting at the potential for an upward surge.
A Showcase of Bullish Precision
Near Protocol executed this falling wedge with textbook precision. What's more, this pattern materialized just above a substantial support zone, further emphasizing its importance. The price approached the pattern with a bounce off this support, retesting the zone before gracefully breaking out.
The Path to Price Appreciation
The breakout from a falling wedge like this suggests that Near Protocol is poised for a considerable price appreciation. Such patterns are often accompanied by increased buying interest and trading volume, creating ideal conditions for substantial upward movements.
Trading Strategy: Capitalizing on the Breakout
For traders and investors in the crypto space, recognizing and capitalizing on these patterns is a fundamental skill. The breakout from a falling wedge can be an excellent opportunity to enter or add to a position, provided it aligns with your overall trading strategy.
Conclusion: Near Protocol's Artful Ascent
Near Protocol's falling wedge breakout is a testament to the artistry that price action can exhibit on the charts. As we witness this spectacular move, it's an opportune time to stay vigilant and explore the potential that this bullish pattern may bring.
🚀 Crypto Insights | 💡 Trading Strategies | 💰 Market Analysis
❗See related ideas below❗
Share your thoughts and insights of Near Protocol. 💚🌐💚

NEAR ready to take action Near ready to take action.
Overall NEARUSDT been bullish over the last days but my trend analysis currently showing some weaknesses and the bouncing from previous fair value gap.
SHORT ENTRY: 1,2
STOPLOSS: 1.265
TAKE PROFIT 1.079
TAKE PROFIT: 1.02

Last support range: 0.830-1.528Hello?
Hello traders!
If you "Follow" us, you can always get new information quickly.
Please also click “Boost”.
Have a good day.
-------------------------------------
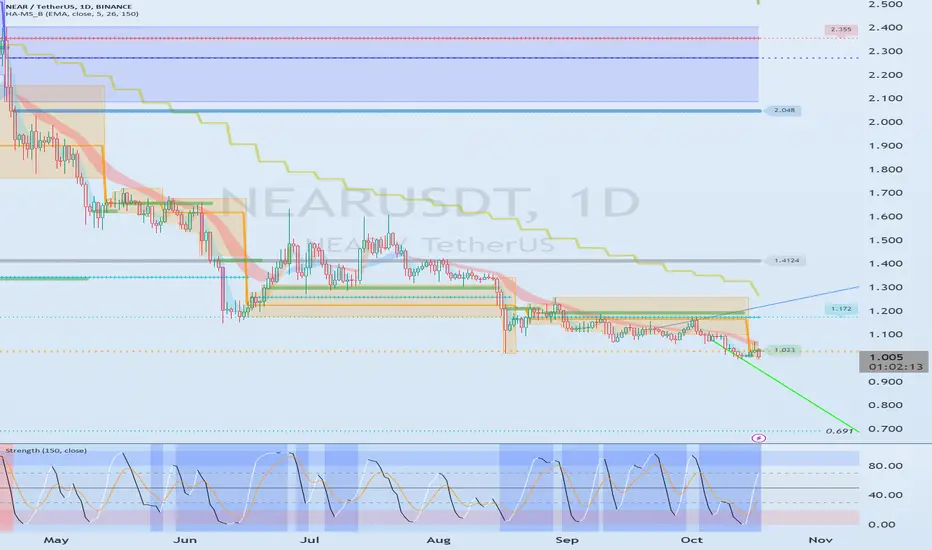
(NEARUSDT chart)
(1M charts)
The key is whether the price can be maintained by rising above 1.99.
(1W chart)
The key is whether it can receive support and rise in the 0.830-1.528 range.
(1D chart)
Since the volume profile section is formed around 1.4124, the key is whether it can rise beyond this point.
If the price cannot be maintained by rising above 1.031, there is a high possibility of a new low, so caution is required.
-------------------------------------------------- -------------------------------------------
** All explanations are for reference only and do not guarantee profit or loss in investment.
** Trading volume is displayed as a candle body based on 10EMA.
How to display (in order from darkest to darkest)
More than 3 times the trading volume of 10EMA > 2.5 times > 2.0 times > 1.25 times > Trading volume below 10EMA
** Even if you know other people’s know-how, it takes a considerable amount of time to make it your own.
** This chart was created using my know-how.
---------------------------------
NEAR/USDT upward momentum? 👀 🚀 NEAR Today Analysis💎 Paradisers, turn your attention to NEARUSDT as it showcases intriguing dynamics, currently positioned within a demand zone and gearing up for a potential bullish ascent.
💎 Upon closer examination, we've noticed that NEAR recently touched the descending channel's resistance, which now serves as its supportive base. Furthermore, should the price surpass the 1.101 threshold, we anticipate a bullish trajectory that could challenge higher levels.
💎 On the flip side, if the price of Nearprotocol breaches the demand zone, it's likely to gravitate towards the support level. As always, strategize your trades with caution and foresight.
💎 Remember to employ prudent trading strategies and use proper stop-loss measures! Stay alert to market movements and look forward to more insights

Near Long USDT 20xNear Long USDT 20x
Entry: 1.1500
Near Long USDT
Target:
1.1610
1.1726
1.1830
1.2001
1.2202
1.2401
Sl 1.08

🔥NEAR Is About to Brake a Huge Triangle❗Most of the holders of NEAR Protocol are now at painful loss. Of course, it's good for us and the whales who want to buy cheaper.
I wouldn't decline that the price will fall below the triangle for a moment, but it doesn't make any impact on a long term picture. Bull market soon!
💥remember that fear in crypto is our biggest friend
like❤️ and follow
Check the links and get a BONUS🎁 from me👇

NEAR/USDT upward momentum? 👀🚀NEAR Today AnalysisParadisers! Gear up for an exciting opportunity with NEARUSDT. Currently, it's stationed in a demand zone and is on the verge of breaking out of a descending channel👀
💎 A few days back, we noticed that NEAR faced rejection three times at the 1.630$ level, which is a supply zone containing a bearish order block. Another key observation is the formation of a descending channel that's poised for an upward breach.
💎 At the moment, the price is consolidating within a narrow range. We're anticipating a breakout from this descending channel, which could propel NEARProtocol upwards. However, keep an eye on the invalidation zone at the 1.08$ level; a breach here could trigger a downward move
💎In the dynamic world of crypto, staying informed and adaptable is key. Stay tuned for more updates and enjoy your trading journey

Near price comes to life!) Holders have been waiting for you)NEAR price has dropped back into the $1.20-1.30 liquidity zone
At the beginning of its trading, NEARUSDT, after breaking through this liquidity zone, began a solid and solid price growth.
In 2023, the NEARUSD price is testing this level for the third time, which is probably a strong mirror zone.
The only nuance is that in six months of 2023, the price of BTC roughly doubled from $15k to $30k, while the price of Near did not.
Therefore, keeping our fingers crossed for NEAR, we can assume that if buyers manage to hold the $1.25 level, they should be able to double the NEARUSDT price to $2.75 just to catch up with the amplitude of BTC's growth.
However, if NEARUSDT drops and consolidates below $1.20, then it's nothing personal, but the next stop from the bottom is $0.90.
_____________________
Did you like our analysis? Leave a comment, like, and follow to get more

Near Getting Ready For Massive Breakout Seems Like getting Ready for Massive Breakout Formed Descending Channel In 2 Days Timeframe Incase Of Breakout Expecting 220 - 250% Bullish Wave📈

NEAR Protocol forecasts bullish ride? 👀 🚀NEAR Today Analysis
💎 NearUSDT has executed a remarkable breakout from the descending channel, indicating that it's primed for a bullish surge.
💎In addition to the breakout, we're also on the brink of witnessing a crossover of the EMA 50. If the price sustains above this EMA, we're in for a profitable trade.
💎The presence of substantial volume amplifies the potential for a bullish move, and trading in a high-demand area is a factor that cannot be overlooked. All these elements collectively point towards a promising upward move.
💎In the dynamic world of crypto, staying informed and adaptable is key. Stay tuned for more updates and enjoy your trading journey.

NEARUSDT may be ready to drop to next weekly support 0.95-1.05The price broke down from weekly support on the last drop a week ago and closed below it. This week it has moved up and almost touching the broken support zone. However, it does not seem like it is going to move up and claim this support. A few hours are left and if that happens in these few hours than it will be bullish and the price will be ready to move up towards the weekly resistance WR1. But from current price action it seems likely that the price may be getting ready for a drop towards weekly support WS2 which is sitting around 0.95-1.05.

NEAR ProtocolHello dear friend
near with btc pair now in the strong Support ... you can buy and hold it
NEAR Protocol is a layer-one blockchain that was designed as a community-run cloud computing platform and that eliminates some of the limitations that have been bogging competing blockchains, such as low transaction speeds, low throughput and poor interoperability. This provides the ideal environment for DApps and creates a developer and user-friendly platform. For instance, NEAR uses human-readable account names, unlike the cryptographic wallet addresses common to Ethereum. NEAR also introduces unique solutions to scaling problems and has its own consensus mechanism called “Doomslug.”
NEAR Protocol is being built by the NEAR Collective, its community that is updating the initial code and releasing updates to the ecosystem. Its declared goal is to build a platform that is “secure enough to manage high value assets like money or identity and performant enough to make them useful for everyday people.”
Flux, a protocol that allows developers to create markets based on assets, commodities, real-world events, and Mintbase, an NFT minting platform are examples of projects being built on NEAR Protocol.

Near exactly followed my pathNear order block entry was shared on 15m time frame which exactly got filled and also profit for shorters. Now it has pumped almost more tham 1.2% and more ways to go from here main target is 1.80++.
best of luck. check bio

Near order blockNear is looking nice from couple of days and now creating nice structure on 15m time frame and also a order block zone which could be best entry for long if price reaches that zone.

NEARUSDTIn the chart, you can see that we have seen a downward movement that has created a downward trend line.
The price was previously rejected by the 0.618 Fibonacci line and was rejected again by the 0.5 Fibonacci line and went down.
I expect the price to rise to $2.075 and go back down, and of course we have good support at $1.75.

NEAR Long ideaFrom my POV I see AMEX:NEAR going to 0.618-0.65 Fib lvl, it’s not a must but thats what I see and we might get a wick to 15 $ As well.
This is not a finance advice nor I am some sort of export, just sharing my thoughts and point of view.

NEARUSDT 4H LONGW in RSI, breaking the middle line and moving RSA, breaking the trend line, suspicious candle, confirming candle, breaking moving 50 in 4 hours BINANCE:NEARUSDT KUCOIN:NEARUSDT

W9.1-35 NEAR BULLISH IDEA (DOUBLE BOTTOM)Potential Bullish Entry Dow Theory In Place - Higher High and Higher Low Expected in Place Formation of DOUBLE bottom coupled with bullish divergence (Bullish reversal pattern) SL & TP Levels are defined.
