NEARUSDT, Breakout from a Micro-double bottom.NEARUSDT / 1W
Hello Traders, welcome back to another market breakdown.
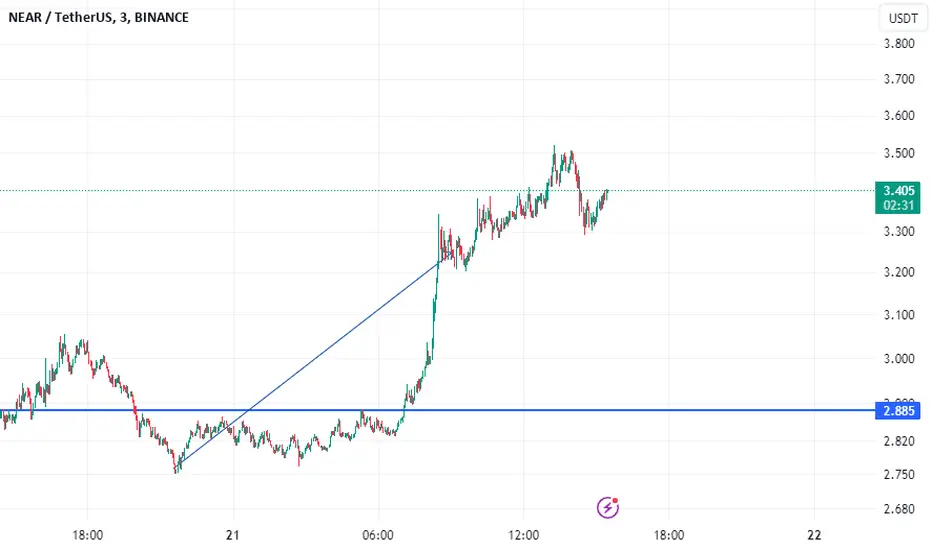
NEARUSDT is one of the charts I'm waiting for to pul-back as well. The price has broken from the range that looks like a Micro-double bottom.
Checkout the chart for where I would like to get a spot entry.
Trade safely,
Trader Leo.
NEARUSDT

NEARUSDT Potential: Predicting a 76% Rally🔅NEARUSDT recently broke above the wedge pattern, accompanied by breaching the long-term downtrend trendline. This move was followed by a significant transformation from supply to demand, evident in the market's response to these zones.
🔅The most recent pullback halted precisely at the 61.8% Fibonacci retracement level, highlighting substantial buying pressure at this critical level.
🔅The current indications heavily favor an uptrend continuation, setting the stage for an anticipated substantial 76% price increase in the coming weeks. As usual, we'll be sharing a comprehensive trade setup in our channel to capitalize on this potential opportunity.

NEAR/USDTWaiting for cryptocurrency market correction to buy NEAR at $2.6 - $2.4 range!
This is Gold! :)

NEAR/USDT Analyzing Bullish Potential from Resistance ?👀🚀💎 Paradisers, let's turn our attention to #NEARUSDT as it showcases a notable trend. The asset is exhibiting signals that suggest a bullish continuation, having recently transitioned from resistance to a potential support zone.
💎 #NEARPROTOCOL recently faced rejection at the $3.826 resistance level, with market sentiment leaning towards selling. However, there's a strong likelihood of a bullish trend continuation from the support level at $2.664. If AMEX:NEAR maintains its momentum above this support, it could set its sights on the substantial resistance level at $5.278.
💎 But, as any seasoned trader knows, having a backup plan is crucial. If #NEAR fails to sustain itself above the $2.664 support, it may be time to consider Plan B. This alternative scenario might involve a bullish recovery from the lower support level at $5.278. Keep in mind, a breach below this level could indicate a shift towards a more significant downward movement. 🌴💰

NEARThe analysis was correct
Support and press the rocket to cheer me up
Observe the ten percent loss limit
Stay away from Bitcoins
Feel free to buy and sell and post your comments
NEAR Protocol NEAR Coin Price PredictionNEAR Protocol NEAR Coin Price Prediction
🔥 Price on the 4H chart might come at these support area and we might get a potential bounce🔥
Potential bounce areas for Buying 2.614 and 2.182
👉 Follow me for More Real Time Opportunities.
Share your Thoughts if you have any?

NEAR LONG IDEA (continuation of the altcoin analysis series)Near has been showing strength in the last couple of days.
Here are two scenarios I see:
Rejection of 1,555, hold above 1,177 and continuation up(200MDA + 100MDA) Do not do anything below that price
Target : 2.835 - 6
Continuation of growth to 2,344, return to the maximum to 1,613 and continuation up
Target : 6
The trend change is also shown on OBV.
In order for this to happen, you need retail that is optimistic

nearSupport and press the rocket to cheer me up
Observe the ten percent loss limit
Stay away from Bitcoins
Feel free to buy and sell and post your comments

Nearusdt Pullback As the first wave luftwaffe is complete we look towards the second wave Luftwaffe. We expect the market to correct towards the 0.22 market levels.

TRADING MASTERCLASS 101Today i explained to you guys the basics of the luftwaffe strategy and how to trade when you see a LUFTWING candle. Thanks so much for your time guys...

NEAR: DECEMBER 16, 2023Currently we are above the median line of the weekly OB, which is the dim red rectangle. The wick above the OB leads me to believe that further upthrust is on the cards. The market has been suffering from indecision for the past week, except for some assets. However, I believe we are going through a breather, which will lead to further upward pressure in the near future. This holds especially true for altcoins, such as Near, that are about to make an official exit from their accumulation range and make a move. The highs, I believe, will most probably taken out in case we flip 2.44. Any acceptance below 2.027 is a sign to get out of this trade for me. I am aiming for 3.443. Please share the idea if you find it useful.

📈 NEAR Protocol (NEAR) Spot Long Trade AnalysisAn analysis of NEAR Protocol (NEAR) suggests a potential spot long trade opportunity, emphasizing support, resistance, and risk management for strategic decision-making.
Key Considerations:
Entry Zone: The proposed entry zone for the spot long trade is between $2.17 - $2.27.
Take Profit (TP): The Take Profit (TP) level is set at the next area of resistance, ranging from $2.60 - $2.75.
Stop Loss (SL): Risk management involves setting the Stop Loss (SL) below both the range low support of $2.17 and the ascending support line, approximately at $2.05.
#NEARProtocol #CryptoTrading #RiskManagement

NEAR/USDT approaching a local top?NEARUSDT analysis using the Unyx Data
Today we take a look at NEAR and its current state in the market:
- BRS: As usual let's get a feeling for the current temperature of NEARs price. We see that it is creeping up towards the over-heated zones 9 and 10 of the Rainbow Score, indicating that we should be ready to take some profits in the coming days.
- BSR: the Strength Reversion showed some sell signals in April (indicated by the red dots) as well as some buy signals in May (green dots). Currently the BSR hasn't triggered any sell signals, but as it is in an Overbuy state, this should happen any time soon.
- BUX: let's finally see what the BUX has to say. First let's take a look at the Oscillator (BUO). It clearly shows a change of trend as it is now moving more on the lower half of the oscillator, indicating that its indicators are mostly overbought. Taking a look at the screener (BUS) we see that in the Daily timeframe, all indicators expect the CCI are overbought. Looking at the smaller timeframes (1h and 4h), the overbought trend isn't much visible, but this will probably change over the day as the European and American markets wake up. On the weekly timeframe again, most of the indicators show an overbought state.
So clearly, NEAR isn't a buy right now, but if you have some in your bags it will soon be a good moment to take some profits. If you bought at the end of the summer, you should be in a profit of around 130%, depending on your average entry price.
Do you have some NEAR in your portfolio? If so, what is your next target price? Let us know!

Long-Term Price Analysis for NEAR Coin!#NEAR
The range we have been waiting for long-term spot buying for NEAR coin is between $1.415 and $1.32. When NEAR coin reaches the zone indicated as blue lines in the analysis, it will have completed a retest move to the trend support.
If NEAR coin initiates an upward movement from the $1.415 - $1.32 range, our target for the upward trend is the $2.20 region.
Our initial purchase for NEAR coin will be at the $1.415 level, and we are placing our second buy order at the $1.32 level.
NFA.

NEAR: UP or DOWN ?
Near had a significant price correction recently and currently it is trying to establish it support level
We can expect this price uncertainty to continue for a while as shown in the above chart.
With the current bullish market sentiment we can expect NEAR price to bounce back.
Im expecting price to move up once it settles in the support zone.
We will keep you posted about our trade entries. Stay tuned
Like and share your thoughts in the comments.
Cheers!
GreenCrypto

NEARUSDT NEARUSDT was trading under declining trendline and recently it seems like the sellers are bit exhausted then bulls took the charge and break through declining trendline.
Currently the price has given the breakout from falling trendline and now forming a local support around 1.80 region.
Will the bulls take charge again continue for leg higher?

NEAR USDT Nearusdt has opportunity to buy at this level for long term investment it will go up to 5$ in next coming weeks, first buying at this level 1.633 and 2nd buy at 1.330 if comes down dont forget to use dollar cost averaging

NEAR ANALYSIS (4H)It seems that the NEAR currency is in a diametric, and now we are in the F wave of this diametric.
After completing wave F on the green box, we can move up for wave G.
For risk management, please don't forget stop loss and capital management
Comment if you have any questions
Thank You

Near Protocol (NEAR) Bulls are Prioritizing Breaking ZoneNear Protocol (NEAR)
While NEAR's price has surged by 120% over the past month, its growth has recently decelerated. The asset is trading in a support zone ranging from $1.70 to $1.83, and buyers appear hesitant to push the asset beyond this range.
Should NEAR continue its upward trajectory amid Bitcoin's positive trend, the token might test the $1.95 mark and encounter resistance in the $2.05-$2.19 zone. Bulls are prioritizing breaking past these local highs. If successful, NEAR might then tackle resistance levels at $2.3 and $2.4.
Beneath its current support zone, NEAR has a potential buyer's level at $1.65 and another zone between $1.46 and $1.55. These levels could be tested even without a Bitcoin market correction, particularly if buyers lack the momentum to drive up prices from their current positions.

The key is whether it can rise above 2.24Hello traders!
If you "Follow" us, you can always get new information quickly.
Please also click “Boost”.
Have a good day.
-------------------------------------
(NEARUSDT chart)
Among the coins that are expanding the coin ecosystem, NEAR is one of the coins that has not yet risen above the MS-Signal indicator on the 1M chart.
Accordingly, the key is whether the price can be maintained above 1.99 and rise above the M-Signal indicator on the 1M chart.
(1W chart)
To do so, it is necessary to check whether the price can be maintained by rising above 2.24.
If that happens, it is expected to lead to a movement to rise above the M-Signal indicator of the 1M chart and an attempt to break through the MS-Signal indicator of the 1M chart.
(1D chart)
The key is whether the price can be maintained by receiving support around the 1.870-1.964 range and rising above 2.272.
Accordingly, it is becoming important whether the price can be supported by rising to the box range of 2.086-2.404.
--------------------------------------------------
- The big picture
The full-fledged upward trend is expected to begin when the price rises above 29K.
This is the section expected to be touched in the next bull market, 81K-95K.
-------------------------------------------------- -------------------------------------------
** All explanations are for reference only and do not guarantee profit or loss in investment.
** Trading volume is displayed as a candle body based on 10EMA.
How to display (in order from darkest to darkest)
More than 3 times the trading volume of 10EMA > 2.5 times > 2.0 times > 1.25 times > Trading volume below 10EMA
** Even if you know other people’s know-how, it takes a considerable amount of time to make it your own.
** This chart was created using my know-how.
---------------------------------

Chart Breakout and Potential TrendsNEAR experienced notable growth following a prolonged period of downward trendline breach. Presently, it has encountered a robust weekly supply zone capable of stalling its upward momentum and potentially directing it downward. The initial support levels stand at $1.680 and $1.513, where we might observe market reactions. Looking ahead, with the weekly downtrend line broken, there's potential for an upward trajectory in the long term, indicating promising growth prospects for NEAR.
This analysis is for informational purposes only and should not be considered as financial advice.

I expect NEAR to rise to $2.12Hello everyone! I have a great idea regarding NEAR.
With the recent upward movement, NEAR has broken out of the accumulation zone, surpassing the first major resistance level, as well as the nearest strong Fibonacci level of 0.236 and the 200-day moving average (EMA 200).
Currently, the asset is within another range of resistance/support, and in a bullish market, it should easily overcome this level.
I believe that the asset is currently in a good range for buying opportunities.
On the chart, the blue horizontal lines indicate other areas of resistance/support for the price.
My final target is a growth up to the 0.618 Fibonacci level, which would bring a profit of 41%.
I also see the possibility of further upward movement towards $2.4 and $2.7.
All targets are shown on the chart.
Please note that this is not financial advice, and any actions you take are at your own risk!

Near $2 loading!BINANCE:NEARUSDT Holding this line strong. Soon we will see 2$.
Note: Do your own research before invest
