NZDUSD Tentative LongThe price needs to break the neckline (as indicated in the markup). Once that neckline is broken, we should see a nice move up. Keep in mind that once the neckline is broken, the move up will be fast due to short covering.
Neckline

GOLD Double top + neckline pullbackHi guy's this is my new analysis on GOLD. No need to explain Everything is clear on the chart
I hope you enjoy it. ;)

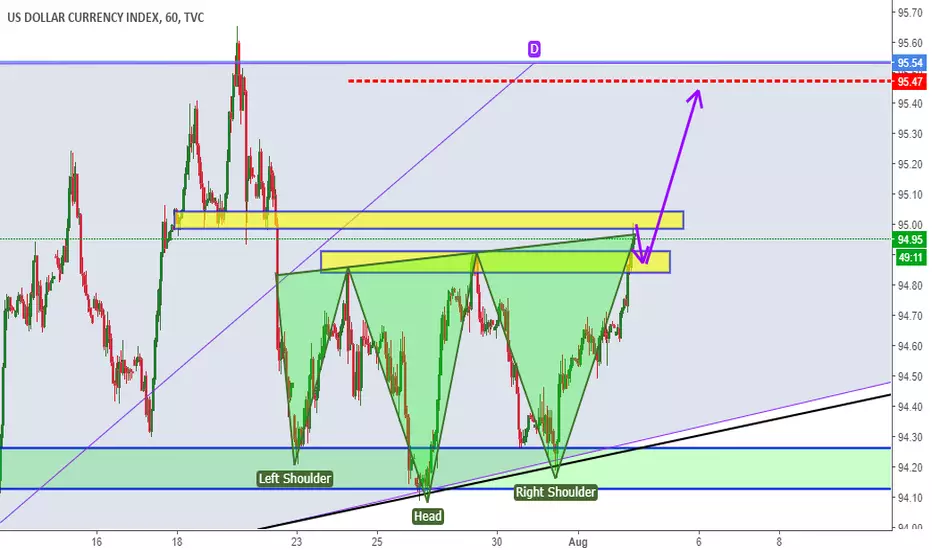
DXY INDEX ANALYSISDXY index broke 98.86-94.91 zone and also the head and shoulders pattern neckline. now we are going to see higher moves for dxy index.
AUDUSD tested top of the triangle, pullbackAUDUSD tested top of the consolidation triangle, pulled back to .618.. than retested the neckline of the top. now heading to the bottom of the triangle. this is a second opportunity to short this pair. if the top of the triangle has been missed. there is a inside bar forming on 1H time frame if we need further confirmation, we can wait next 15min, at the time of writing, for the bar to close and than look for a break to the down side,, as upside break is likely to run into resistance quickly at this point.

EURSGD Short - 618 and Neckline ConfluenceHigh probability trade with a 3:1 or more risk/reward ratio.
Consolidation happening at an important level.

AUDUSD multiple optionsIt looks like we are going to see some bullish momentum over the coming weeks for this pair, it seems like the price has touched the support level and lost most of its pushing momentum. This shows that the price is not looking strong enough to break through this critical support level, if this support level holds then this would mean the price is going to move up from here, as we have saw before I believe the price could make its way up to the previous high (black) around 0.809. There is also another possibility, there is a chance as a double top has formed in the channel that the price is going to test the neckline (red) and if it bounces we could see the price breakout the bottom of the channel. I would update this post once I have got more information to share about the future direction of this currency pair.

Seeya BitcoinHead & shoulders pattern forming on Bitcoin.
There is a demand zone shaded in blue that is acting as the last support. I'm expecting this to break, and break well with volume. A sloping neckline always performs better!
Volume is also decreasing on the right shoulder. All signs of a downward breakout.
Target is the green line, stops above red line once the neckline breaks.
Please give this trade idea a THUMBS UP and I will keep you updated!
Disclaimer: This is only my opinion, make of it what you wish. It is not financial advice.

USD/CAD H&S pattern PA retest neckline resistanceUSD/CAD H&S pattern, where PA retest neckline resistance and the arrows shows the possible direction of the next move and the targets to be achieved!

Bitcoin to push towards $8,700 nextHaven't posted a BTC chart in a while. It's been quite the ride so far and expect the bullish momentum to continue.
The last few days has seen Bitcoin retrace and consolidate. The selling pressure has not been extreme and likely to be profit taking only. With that said, buying on dips is a good strategy for now.
On the 1 hour chart, a possible inverted head & shoulders is forming. This is just the pattern to add to an existing long position on the break of the neckline. The projected target is near the $8,700 area.
Volume is already starting to decrease in the right shoulder, which is a lot smaller than the left and ideal scenario for a breakout past the neckline.
Please give this trade idea a THUMBS UP and I will keep you updated!
Disclaimer: This is only my opinion, make of it what you wish. It is not financial advice.


Possible inverse H&S ETH/BTCNeckline sits at about 0.055 and at the moment, it looks like the right shoulder probably won't start to form until late August. Target-wise I think we'll see 0.1 again before the end of the year.

BTC may be forming a cup and handle.Just my opinion, but with both the 4hr charts rsi and stochrsi well exhausted and well into the overbought zone and the 1 day chart's indicators now just reaching overbought conditions, I don't think we will be able to sustain an immediate breakout of the inverted head and shoulder pattern and a small correction is due to reset these indicator levels before a breakout can be sustained. at the same time we would like to see the price reach $6850 or so before any type of correction or retracement to establish a higher high on the 1 day chart and keep the ball in the bulls court. We can also see a very cup like price pattern has formed on this right shoulder. Also keep in mind that cme futures are set to expire on July 27th. All things considered my guess is that one of the 4hr candles that occur today will hit the $6850 region to complete the rimline of this cup pattern and then for the next 10 days or so we will see it form a handle until those futures expire at which point we will break above the cups rimline, the neckline of the inverse head and shoulder and the symmetrical triangle pattern we are in. Perhaps it will be Q3 which is the bullish one this year.

Sending bullwicks above the inverted head and shoulders necklineLooking at the 1 day chart we see a very promising sign here that the higher low/higher high bull pattern might continue. We need the price action to climb to 6850 or so to form a new higher high on the 1 day chart before the next significant breakdown happens. If so odds are food the following down trend will only form a higher low on the 1 day chart which will continue to allow the bulls to control the momentum. I already exited my position at 6690 and will be setting a stop buy up around 6894 to be safe. I think once we achieve the higher high on the 1 day chart a correction will be overdue and we will likely dip. I'm thinking we won't dip under 6.1k though before the next uptrend and will confirm a higher low at that point. All just my opinion though I could easily be wrong. As always not financial advice. Thanks for reading and best of luck!

BTC IH&S Still Looking GoodFollowing through from the chart on the 6th. Would like to see consolidation today before another test of our latest high. RSI levels very high at the moment.

BTCUSD - inverted H&S!It looks like the inverted head and shoulders pattern is still forming, if this pattern is able to fully form it is very likely the price of bitcoin would start to rise and we could see the price test the resistance level of the triangle (A). We will have to wait and see if the price reaches the low of the previous shoulder and is able to bounce, if the price fails to bounce we could see further bearish moves. I will keep everyone updated on this pair over the coming weeks.

EURUSD - H&S back on!The head and shoulders pattern looks like it would form once again. We have saw a double bottom form at the support level and the price has broken the neckline of the double bottom and looks like the price is now retesting the broken neckline, if this broken resistance now acts as a support level its a great position to enter a long trade. If the price starts to rally we could see this long awaited head and shoulders patter form. I will keep everyone updated on this pair over the coming weeks.

rising wedge still valid; 4hr srochrsi reset.As I had said an idea or so ago we will likely fake a breakout once or twice to reset rsi and stochrsi levels before w have enough momentum to break above the neckline of the inverted head & shoulders pattern. What was once looking like your average bull flag has morphed into a sort of small falling broadening wedge and now are 4hr stoch rsi is ready to go up again. I was also able to widen the bottom trendline of the rising wedge slightly and still maintain it's trend validity. So unless we see a big surge in bear volume here we are still inside the rising wedge and also found support at the wedge. If we do break down from the lavender wedge we may drop all the way back down to retest the bottom trendline of the symmetrical triangle. I think probability favors the uptrend still especially with the recent 4hr golden cross but need to anticipate the opposite happening as well. Just my opinion and not intended as financial advice. Good luck out there and thanks for reading.

NEO struggles to stay above necklineNEO has printed what seems to be a clear Head & Shoulders pattern on the 4 Hourly - this is often characteristic of am imminent bearish scenario. However, for this to take place, NEO needs to break below the neckline to complete the H&S. The bearish case is for the projected neckline to coincide perfectly with the lower support level (in red) to complete a possible 'double bottom'.
Nonetheless, the bullish scenario would be for NEO to bounce on this neckline to retest its previous high (in green).
Happy trading out there :)

Testing the Neckline of the Inverted Head & Shoulders PatternA nice bull surge has taken us to the neckline of the inverted head and shoulders pattern! We pierced it on the last candle..if we can close a couple candles above the neckline I'm fairly confident we will be revisiting the rimline of the inverted cup and handle pattern we broke down from last month. Breaking out from the inverted head and shoulder pattern will also allow us to break upward from the current pink symmetrical triangle we are in as well. However we need to keep an eye on the top trendline of the rising wedge we are still in (in lavender) breaking above this would be a very bullish sign indeed. As with all head and shoulder patterns...wait for the breakout (lots of bullish volume) to decide what to do, as they often times will end up being fakeouts. Good luck in whatever you decide to do, remember this is not financial advice, and thanks for reading!


BTC 1Hr Possible Inverse Head and ShouldersWatching for another dip to complete the right side of this Inverse Head and Shoulders pattern. Looks like just around $6,800 is our neckline. Could take a day or two for this pattern to play out. Watching for a break of the Neckline for a Long entry. A dip below our Head would invalidate this pattern.

AUDUSD Potential Pullbackon the weekly chart we can see in these 3 weeks price cannot break the support and make some rejection.
and on 4H chart we have bullish divergent and potentially make an inverted head and shoulders pattern as a reversal pattern.
entry strategy will be taken on smaller TF.
SL will be below the head

GBPCAD SellOn the daily previous candle make a pinbar and look reject from previous structure resistant.
we can consider to take a short position on the smaller TF.
M30 price pullback to previous structure to short, or wait at 50 percent retracement.
