Cup & Handles forming all over cryptomrkt; TRX just broke above!I never thought I'd find myself posting an idea chart for crypto but I have been following all these potential cup and handle patterns forming all across the crypto market closely all day. It seems as if Bitcoin Cash and Zclassic were the first ones to trigger....meanwhile other great alts have been slowly forming their respective handles to their cups all day including, Siacoin, Bitshares, Digibyte, Digital Note, Ripple, Steller, Cardano, Iota, Storm,BNB, and Ethereum just to name a few....most of those cups and handles have completed their handles and are now trying to rise up to break their necklines some still are finishing out their handles....but the first big one of these alts to break the rim/neckline of its cup and handle pattern appears to be none other than Tron! After zclassic,bitcoin gold, and bitcoin cash....Tron is next out of the gate to achieve cup launch which is a great sign for the odds of btc continuing its bull run...the more alts that start triggering their cup and handles the better the odds of us being able to break upward out of the current rising wedge BTC is stuck inside. Here on this chart I have drawn the breakout projection with the appropriate pricepoint on top...not a bad idea to take a ride on the troncycle to the top of the dotted line and then see if fomo or any other factors allow it to continue up any further. For me this will likely be a short term entry and not a long term hold. UYou choose your own path however because this is not meant to be taken as financial advice. I expect many more cup and handles in the alt market to trigger not much longer after tron so keep your eyes out on any cup and handles I may not have noticed and also keep your eyes on the ones I listed above. Thans for reading and good luck
Neckline


CADCHF Simple Trademomentum is slowing down, price break minor uptrend channel.
look for some downside movement.
stop on the red line, target on chart

Two potential inverse head and shoulders scenariosThere are two potential inverse H&S scenarios playing out for ethereum. I have overlaid both on the chart, one in blue and the other in green. We are currently in a potential bearish flag (purple parallel line) and it all depends on how this breaks.
Scenario #1 (green): the flag is currently forming at the 0.786 fib retracement since last bottom and top and may be a short term reversal, however this is not supported by the volume (trending down and full of bear activity). If this somehow breaks up then we could be forming a IHS that will probably be rejected at the neckline at first but then may cross on a second attempt. I recommend a buy at this break (on the pullback to retest the neckline) with a reasonable stop below the neckline. This might leave us in the area of $450-470 where I recommend a heard sell and then wait to see what happens. If we break that major outermost trendline then we might be headed to even higher highs but from my previous analysis I still see a leg further down so don't count on it. I'll have more analysis before then.
Scenario #2 (blue): the flag breaks downwards and touched the bottom trendline. Support here will confirm a typically bullish descending right angle broadening wedge where Bulkowski recommends a buy at this third touch with a pretty tight stop below the trendline. We would then likely work our way up to test the neckline, fighting through some resistances along the way, and eventually be rejected at first, drop down, create a right shoulder, retest the neckline, maybe get rejected slightly but then break and head towards the major resistance trendline where once again recommend a hard sell between $440-460. Don't follow the timeline of the drawings exactly, there should be a lot of up and down before the neckline is reached.
We had a very similar set up following the March $7200 bottom for bitcoin where the first push (similar to the last few days) came short of the trendline, consolidated, and the second push touched but then got rejected bringing us to new lows. I expect something similar.
This is up to 5 days out and a lot can happen between now and then and ultimately it relies on bitcoin and what its price action is doing. Both bitcoin and ethereum have room down and we should not yet be at our true bottom.
If we break this bottom trendline somewhere near the stop then don't bother jumping in until we see something more concrete. The market is still bearish so these are short term swing plays.
Peace and love,
crypt0guy

Inverse H&S scenario or wedge bottom or pits of hellBitcoin is currently consolidating in a bearish flag (purple lines). This often marks the halfway point of a move. We are also currently in a descending right angled broadening wedge (dashed lines) which is typically bullish according to Thomas Bulkowski. I don't anticipate a break upwards on this, however if we do then consider taking a position above the top trendline on the pullback with a stop right under that line. My two more likely scenarios are forming an inverse head and shoulders or a further decline to new lows. The most likely trajectory is the bold red line.
Scenario #1: this flag breaks bearish and lands us right near the February bottom of ~$5800. This would also be the bottom trendline of the megaphone shaped descending right angled broadening wedge. It is typically recommended to play these patterns at the third bottom touch and seeing that it is also the $5800 area bottom, we might see a lot of activity in this area and is a strong buy recommendation with a stop just below the bottom trendline of the megaphone. If it bounces up here, then move your stop loss up below every MAJOR consolidation on the way up. I cannot definitively say anything about where a sell target is on this move so my best recommendation is to follow it because this might in fact be the bottom we are looking for. The IHS should terminate near the major bearish trendline that has contained the market since the all time high. We will likely be rejected at first and if you want to protect profits then take them at this trendline and re-enter if we break through.
Scenario #2: flag breaks bearish but IHS fails to form in which case, wherever we get rejected we would be headed to new lows where the next good buying opportunity would be near the support trendline since February 24th. This would also complete the descending wedge pattern forming since then and is also a strong buy opportunity with a stop not to far below that trendline support because if we fail there then who know where we are headed. However, if we break back into the wedge, then consider re-entering. I play conservatively and have no problem losing some potential profits on that.
Peace & Love,
crypt0guy

CADJPY GartleyPrice complete Gartley on retest the neckline.
we can take a short position with this setup :

NDJJPY SHORT SETUP * Awaiting price to close on neckline of doubletop.
- A break of Counter Trendline will signal potential sells if confirmed below it.
- break and retest of neckline 80/20% Sell

GBPCAD Potential UpsideOverall price is still in the bullish movement.
Currently price in the correction structure and potentially make another impulse to the upside.
I expect some downside to complete the patterns and test the support area before it take off

Gold Transition Eventually CypherLong setup using trend transition.
we can take a long position on the potential right shoulders, confluence with the neckline
3 target on chart.
final target is Cypher completion.
Stop below head


BTC has yet to close 2 consecutive 4 hour candles above the neckBTC has yet to close 2 consecutive 4 hour candles above the neckline and instead continues to flirt with it and play hard to get. We've bounced under the tline but are still well above the 50EMA as well as the buy sell sign so it's still very much a buyers market see this as an opportunity to buy the dips...with each passing day breaking the neckline shoudl become easier and easier to acvhieve though so far we've yet to close a singlr 1 day candle on the 1 day chart above the neckline. I still am fairly confident and maybe a little more hopeful than my own good that we will soon see a close of at least 3 consecutive 4 hour candles above the neckline, and hopefully 2 consecutive 1 day candles finally confirming a breakout. One downside to a prolonged breakout is since this inverted h& shoudlers is sloping downward the longer it takes to break the neckline the lower the target price spike of the breakout becomes. I'd say if we're still gonna see a breakout it's gonna happen sometimes this upcoming week or at the very latest by the 15th.

BTCUSD/T necklines on 4 different exchangesBTCUSD or BTCUSDT approaching the inverted head and shoulders neckline (red)

We officially have gone above the neckline!We are officially above the neckline on the 4hr chart!! And with only 4 minutes left to go before this 4 hour candle closes...we may actually close this candle above the neckline! Very exciting time to be invested in btc! Now remember folks we still even if it closes above the neckline on the 4 hr chart are going to need the next 4 hr candle to close above it as well...we also want to see a huge swell in bullish volume to help confirm it. Also always good to double check indicators such as mac d and rsi to be safe....the biggest confirmation won't be until we have closed to 1day candles above the neckline...however 2 4hr candles closing above is a really good sign...I would even tread lightly and wait for a 3rd 4 hr candle if I was being super conservative. We may very well see the price dip back udner the neckline as a false breakout initially though so be prepared if that happens I imagine it will only take another day or 2 max before we get a legitimate breakout. Of course, this could be the legitimate breakout and we might not even ahve to worry about any fake outs. Best to be patient and see just to be safe though.

Bitcoin is flirting with the neckline!Bitcoins bulls have been unstoppabull recently and witht he current price around 11430 it only has to reach 11600 to be firmly above the neckline. If it can close above on the 4hr and then close another followup 4 hour candle above that, odds are very good at that point that we have a valid inverted head and shoulders on our hands....those who have been following me for awhile now will realize that I was the first to call a second much more massive inverted head and shoulders that used the same head as the first one we saw weeks ago. I was calling this to happen before the second potential shoulder had even began to form. At the time I was calling it hypothetical because I wasn't certain a head of a head and shoudle rpattern could be triggered twice. Now that we are this close I'm pretty confident we will see it break/close above the neckline and form a valid pattern. Of course until it does that it won't be valid, but I'm more confident now than ever before that it will. Today's big resistance is at 11500...if the bulls can topple that as easily as they did the resistance lines of 11120, 11300, and 11400 yesterday then I see us very potential breaking above the neckline as early as the upcoming 1 day candle. it may decide to trade sideways for a day or 2 and possibly even retrace a slight bit before this happens though. So hodl with all your might and I reccomend buying in more at any convenient dips.
EURUSD DAILYSimple trend analysis here, price broke the neckline to its double top off monthly resistance. Price may head down to the 1.20800 zone to retest a strong previous supply zone, where I will look for a rejection or break back below for a continue of a bearish trend.

AUDNZD 4HPrice created a inverse Head on Shoulders pattern, recently breaking above the neckline & now price is retesting broken resistance as new support now. NZD press conference shortly will be watching price action...

XAUUSD 60Potential inverse H&S pattern here rejecting off daily support 1325, price could now see a potential rise back to the upside. Watching for a break of the neckline for potential longs..

H&S Pattern about to break through neckline on BTCH&S Pattern about to break through neckline on BTC.
If the necline breaks then there should be more correction to come.

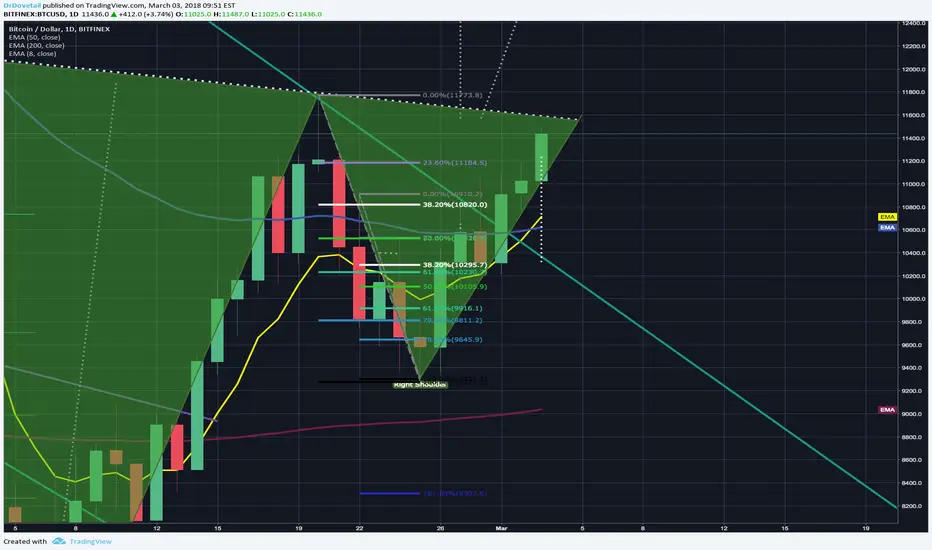
[BTC/USD] BITCOIN-ALL INDICATORS LOOK BULLISH NOW! BEARS LOST! Well, after many weeks in agony waiting to see what Bitcoin actually does, I believe today is the day for me to pull the trigger. On this video you will hear about all the indicators yelling bullish signals. This inverse head and shoulders was confirmed for me and completed when it broke the neck line resistance on Valentines day Feb 14th, 2018, indicating a bullish reversal about to take effect. The average rise when this happens is approximately 38% up. So, I marked it and also used some Fibonacci retracement lines for some targets.
In a way this sucks, because I really wanted to buy bitcoin at about 6k or lower, but unfortunately I didn't get that chance.. The charts are telling me something totally different despite my bias emotions of hoping it would go down. So I'm sticking with the charts and going all in today. The next major period when I believe FUD will occur may cause some panic selling with potentially the G20 Summit this year in Buenos Aires, Argentina Nov 30th, 2018. Germany and France and other countries will heavy regulate crypto which may cause some panic selling and we may see some lower lows. For now, I believe the growth or momentum will be slowly back up in a bullish trend some normal healthy dips... Per my observation, I believe the bear trend might be over! If I'm wrong then I guess I wont loose and neither will many others since you will be able to buy bitcoin much, much lower.. But based on my observation of these charts today don't count it!
So, for now this agony and anticipation is over! I can finally chill out now and have some fun!
If you enjoyed this video don't forget to like it..
Thanks,
CryptoBuzzAnalysis
PS. Disclosure: This is not financial or trading advice. You are responsible for you own actions and should do your own research.

EURNZD DAILYInverse head on shoulders neckline broken, now watching for a retest to broken resistance turning support to jump in this pair..

usdnok inverted h&sinverted H&S was shown in the 1hr timeframe of the pair so looking to buy above neckline

Dollar Index (DXY)Price breaking below its head & shoulders neckline, a daily close below will send this pair to the 91.30 ish area ...
