Text book bullish W-Bottom on weekly. Huge gains here.
USDDKK and a Weekly chart Double-bottom which has just passed through the neckline.
Look for a retrace back to neckline.
On USD strength at the moment, this is sure to climb during trading today and the next several weeks. Massive RR. Thx Chris.
Stupid-bloody software. Ignore the chart above. I tried to delete and overwrite but this damn software that some of us spend so much time is simply bs.
Here is a 5m chart showing the breakout and a retest back on the neckline which is the red-dotted line. It may conduct a retest again or look for a fib retracement or a good ol' market order at these low levels.
Be aware that Double bottom breakouts even over and beyond neckline, often retrace in a big way back underneath the neckline to push traders patience and take stops. Then price breaks out again.
I can't see the above happening because this is a weekly chart firstly, plus the USD is too strong in momentum currently.
Your're welcome:)
Necklinebreak

I am Short XAU USD...Why? See charts below..
XAU USD is very weak on the important Weekly timeframe.
There are also Double Tops on multiple timeframes. Recently on the 2m chart the MTOP formation was breached.
Look for a retracement back above the neckline and look for an easy short.

4015: Neckline BreakoutPrice is moving in Cup formation (continuous formation of HH, HL)
A significant Neckline (Resistance) is broken.
Wait for retest for a conservative entry.
Trade as per risk.

Tesla Analysis!NASDAQ:TSLA Analysis on a Weekly Timeframe!
Multiyear trendline breakout in Tesla!
Inverted Head and Shoulders Pattern formation at Support!
Neckline breakout in Tesla!
Of course we have missed the entry in a Tesla but take is as a learning. Where I have combined Multiyear Resistance trendline with Inverted Head and Shoulders Pattern. So what we need to do is ,Identify the chart pattern on a longer timeframe and after that on the event of breakout need to come down to lower timeframe. As I marked all the levels on a weekly timeframe but we can enter in the stock on a Daily Timeframe.
Disclaimer = Consider my analysis for Educational Purposes only.
Before entering into any trade -
1) Educate Yourself
2) Do your research and analysis
3) Define your Risk to Reward ratio
4) Don't trade with full capital

PYPL Momentum Stalls REVERSAL / SHORT idea PYPL has had a great past two weeks putting in 7-9% gain. In the past week however, that
momentum has stalled. PYPL has printed a head and shoulders pattern. The predictive algo
of Lux algo suggests a reversal here. PYPL has been resisted on the higher price action
by the second upper anchored VWAP band. The H & S pattern neckline is about 63.
The predictive algorithm of LuxAlgo shows a forecast of downward price action as shown on
the black line to the right of the last candle.
I will close my long position here. Once price falls under 63, I will instead take a short
position targeting 61.35 and 59.35 being the area immediately above the mean VWAP
and first lower VWAP lines respectively. I will also look for the green RSI line to fall under
50 as an entry signal. In keeping with good risk management, the initial stop loss will be
63.15 with an adjustment of 0.12 for every 0.15 of price fall until the first target. I will take
off one third of the position and adjust the stop loss by a trialing ATR after that.

TSLA makes progress in trend up LONGTSLA on the 120-minute time frame has finished off an inverse head and shoulders pattern with
the bottoms on January 26 February 6 and February 14 respectively. Price rose above the
neckline at 197 and appears to be trending to retest it. My target is 220 which is the 0.5 Fib
level of the prior immediate recent January trend down. The relative strength fast line
is dipping for a bounce off the 50 level horizontal line. The past RSI indicator shows much
improvement in strength. I will buy TSLA shares and options when price gets retraced to about
197 =/- 0.50. I expect this will happen on the next down general market day which could
be as early as the morning after this present holiday.

CHFJPY: Uptrend Faces Risks - Short Opportunity on the Horizon📈 Overview:
CHFJPY's uptrend encounters challenges with a flat top, bearish RSI divergence, and a bearish market sentiment above 90%. The neckline break signals a potential shift.
📊 Technical Analysis:
Flat top, RSI divergence, and neckline break indicate a possible reversal in CHFJPY's upward momentum.
📉 Trade Strategy:
Traders may consider a short position near the 0.236 Fibonacci level, aligning with the technical signals and bearish sentiment.
🛑 Risk Management:
Implementing stop-loss orders is crucial to manage risks during potential market reversals.
📉 Conclusion:
CHFJPY presents a short opportunity as technical signals and market sentiment point towards a potential downturn. Exercise caution and employ risk management strategies.

NZDCADIs NZDCAD exhausting at highs?
As the price is been on high bull run but now it seems like price is lacking bullish momentum after printing double top pattern at resistance level and bearish divergence( on lower time frame) suggesting the sell pressure is about to start.
If the bears took control , the 1st target could be 0.88600 What you guys think of it?

AUDUSDIs AUDUSD exhausting at highs?
As the price is been on high bull run but now it seems like price is lacking bullish momentum after printing double top pattern at resistance level and bearish divergence( on lower time frame) suggesting the sell pressure is about to start.
If the bears took control , the 1st target could be 0.88600 What you guys think of it?

GBPNZDIs GBPNZD exhausting at highs?
As the price is been on high bull run but now it seems like price is lacking bullish momentum after printing double top pattern at resistance level and bearish divergence suggesting the sell pressure is about to start.
If the bears took control , the 1st target could be 2.02 level
What you guys think of it?

STX - broke out of CUP consolidationSTX rise that began in late Dec last year was disrupted as it went into a multi-month cup consolidation from February. Last week, it finally broke above the neckline of this CUP @ 71.50 on strong volume.
A number of technical signals are now going right for STX and it appears a trend continuation is underway:
1. its 200 day moving average is now subtly curving upwards
2. MACD on its MONTHLY chart has now begun to cross up into positive territory. This is significant and likely signals a longer term bullish outlook (whip saws not withstanding).
Any dip back towards the neckline @ 71.50 will be a lower risk opportunity to long with initial stop loss below 67.50. Trail profits up should trade goes our way.
Disclaimer:
TA is about improving our odds of a successful trade (not a guarantee). This is just my own analysis and opinion for discussion and is NOT a trade advice. Kindly do your own due diligence and trade according to your own risk tolerance and don't forget that money management is (probably the most) important! Take care and Good Luck!

DOTUSDTA Bullish Movement May Happen Soon
DOTUSDT has formed inverted head and shoulder and break the neckline as well.
Currently the price is testing neckline and it seems like it is ready to fly.
Currently the price is maintaining bullish momentum as well.

GNRC - trending upAnother typical example of a stock breaking up (into a new uptrend) after forming a base:
1. Broke out of the neckline and did a classic retest of this neckline a few days later, affirming the neckline as the new support
2. trading above it's 200 day moving average
3. Golden cross for additional confirmation that the stock is in "recovery"
Recent volume was not exceptional though, hence how far the stock could rise remains to be seen. Initial stop loss just under 131 (below most recent pivot low @ 131.35).
Watch out for earnings expected around 26 July. Might be prudent to take some profits off prior to earnings release.
Disclaimer: Just my 2 cents and not a trade advice. Kindly do your own due diligence and trade according to your own risk tolerance and don't forget that money management is (probably the most) important! Take care and Good Luck!

RIOT - uptrend underway (painstakingly but surely)RIOT formed an Adam and Eve base formation and began to break out of its first neckline @7.80 on 17 March. We then saw a classic "breakup and retest (of neckline) several days later before it began to propel on strong volume to break decisively above its 2nd neckline @10.50.
Alas, just when we thought it was on its way to the moon after hitting high of 14.43 on 18 April (almost doubling from its first neckline@ 7.80), it then went into a messy and violent wedge consolidation for the next 2.5 months ("death by a thousand cuts"! LOL).
Finally on 3rd July, it broke out of this wedge decisively and today (3 days later) we have another clear break above its last significant high @ 14.43. The stock is clearly in a rising trend now (and likely more small cap stocks will follow suit in the coming months).
Stops raised to just under 12.60 now.
Disclaimer: Just my 2 cents and not a trade advice. Kindly do your own due diligence and trade according to your own risk tolerance and don't forget that money management is (probably the most) important! Take care and Good Luck!

RIVN - could break up in near futureRIVN went into basing formation since March 2023, testing the level 15.60 (neckline1) at least 4 times before a successful break up on 29 June, followed 2 days later by a huge volume gap up 3rd July. As of yesterday it closed right at the 2nd neckline @ 21.70, which incidentally is just above it's 200 day moving average (a positive).
It's RSI is very strong and there is a reasonable chance it could be breaking above this neckline2 very soon (scenario 1 indicated in red). However, as it is also rather overbought at the moment, we could see another pullback before another attempt to break up (scenario 2 indicated in blue).
Long the break of neckline 2 with initial stop loss below 19.30 (the recent 2 candles low).
The market is volatile and trade management with trailing stops is a good idea. Balancing between how much wiggle room to give it (ie where to place the stop loss) will take some practice and experience.
Disclaimer: Just my 2 cents and not a trade advice. Kindly do your own due diligence and trade according to your own risk tolerance and don't forget that money management is

AUDCHF I Will retest neck of double bottomWelcome back! Let me know your thoughts in the comments!
** AUDCHF Analysis - Listen to video!
We recommend that you keep this pair on your watchlist and enter when the entry criteria of your strategy is met.
Please support this idea with a LIKE and COMMENT if you find it useful and Click "Follow" on our profile if you'd like these trade ideas delivered straight to your email in the future.
Thanks for your continued support!

TSLA - turned the corner?TSLA had been on a wild ride down since peaking on 4th Nov 2021, with many strong bear rallies in between. It finally hit the bottom on 6th Jan this year and began a rather strong rally until early Feb where it started to churn violently for the next 2.5 months, shaking out any weak bulls.
A sustainable rally emerged again from 27 Apr and more signs have been emerging that the longer term trend have changed to bullish (short term pullbacks not withstanding):
1. a close above the 200 day moving average on 31 May and continued to propel higher for more than a week now
2. a break above a longer-term neckline in the region of 200-215 this week and
3. RSI line on it's MONTHLY chart has crossed above the 14 SMA line (signifying the likely emergence of a longer-term bullish trend).
However, TSLA has been traditionally a volatile stock, hence it is safer to wait some dips to go long. Any retracements in the near term should preferably not breach the neckline support (200 - 215), although it is not up to us to decide how far it would pull-back .
Wait to see the stock finding possible support (after a retracement) to go long (with stop loss below the most recent pivot low).
Disclaimer: Just my 2 cents and not a trade advice. I may have an opinion but I do not hope. Cut loss (sooner rather than later) and move on if wrong. Kindly do your own due diligence and trade according to your own risk tolerance and don't forget that money management is important! Take care and Good Luck!

TAP - start of bullish trend?TAP bottomed in Sept 2020 and began to move higher till 7 Jun2021, after which it made no further progress and pretty much churned sideways in a wide range for the next 11 months.
Finally, on 2nd May this year, it began to propel strongly above the neckline due to positive earnings surprise. However, it then began to pullback over the following few weeks, all the way close to the neckline before staging a strong rebound. This is a classic breakup and retest that affirms that the neckline (formerly a strong resistence) is now the new "support".
The stock appears to be poised to began an uptrend that could last a while. The next strong resistence could be around $75. However, it is just a level to look out for and nothing is cast in stone. Trade management (which varies according to one's trading style and temperament) is required to see how far one is able to ride a trend.
Disclaimer: Just my 2 cents and not a trade advice. Kindly do your own due diligence and trade according to your own risk tolerance and don't forget that money management is important! Take care and Good Luck!

BASE - Inverted Head & ShouldersFor the past 3 weeks, BASE has seen higher volume (accumulation) leading it to break out of an inverted Head & Shoulders Formation (bullish) last week. With earning expected on 6th June, it is likey that it's earnings could be positive. However, whether the recent up move has already factored in a positive earning (and then "sell on news") remains to be seen.
If it started to sell off on "news" after earnings is announced, it could present good entry opportunity to long if it remains supported above the 50% retracement of it's recent upswing AB.
However, if it gaps up after earnings, then we need wait and see if it begins to consolidate before looking for signals to long (bullish patterns, divergence, fib support, gap close etc).
This inverted H&S basing formation had formed over 12 months+ and looks to be credible for longer term upside, not to mention it is also now above it's 200 day MA (although it could be risky to long in the short term due to earning announcement risks). Let's see what happens after earnings and whether opportunity to long present itself after.
Disclaimer: Just my 2 cents and not a trade advice. Kindly do your own due diligence and trade according to your own risk tolerance and don't forget that money management is important! Take care and Good Luck!

Gold prepared for another bearish tumbleGold has retraced to the neckline of the double top pattern, upon which it provided a strong bearish engulfing. The weekly resistance has failed to be completely broken in addition to a rejection of the 38% fib. The 4H is trading within a range creating a new lower low along with ADX. The moving average is crossing to the downside as well as a trendline break to the downside. Price is now on the short side of the trendline. I will look for shorts near the weekly resistance for a 4H lower high. or a complete retest of the major 38% where the daily was rejected. Targets for shorts are -27%. extended target at -61%.

SKX - Cup & HandleSKX has trended above it's 200 day moving average since 11 Nov 2022 and began to consolidate in a mini cup pattern ("handle" if we look at the monthly timeframe) for the last 3 months. It has just broken above this mini cup neckline @ 49 strongly after earnings beat and is now heading towards a more significant neckline (54 - 56 zone). If it is able to break and stay above this major neckline, then there is room to go higher as it begin a new up trend.
Ideally we would like to see a minor pullback shortly after the breakup to retest and affirm that the neckline has become the new support. However this may or may not happen and we should manage the trade with trailing stops (usually placed at near term pivot lows, gap fill or some fib levels).
Disclaimer: Just my 2 cents and not a trade advice. Kindly do your own due diligence and trade according to your own risk tolerance and don't forget that money management (ie postion sizing, stop loss etc) is important! Take care and Good Luck!

USDCHF - Bearish Double Top 📉Hey Traders !
The USDCHF Price Reached a 0.5 FIB Level !
Currently, The Price Formed a Double Top Pattern !
The Neckline is Broken 🔥
If Price Stays Under The Key Zone, USDCHF Can Continue The Bearish move !
-----
TARGET: 0.88650🎯
___________
if you agreed with this IDEA, please leave a LIKE, SUBSCRIBE or COMMENT!

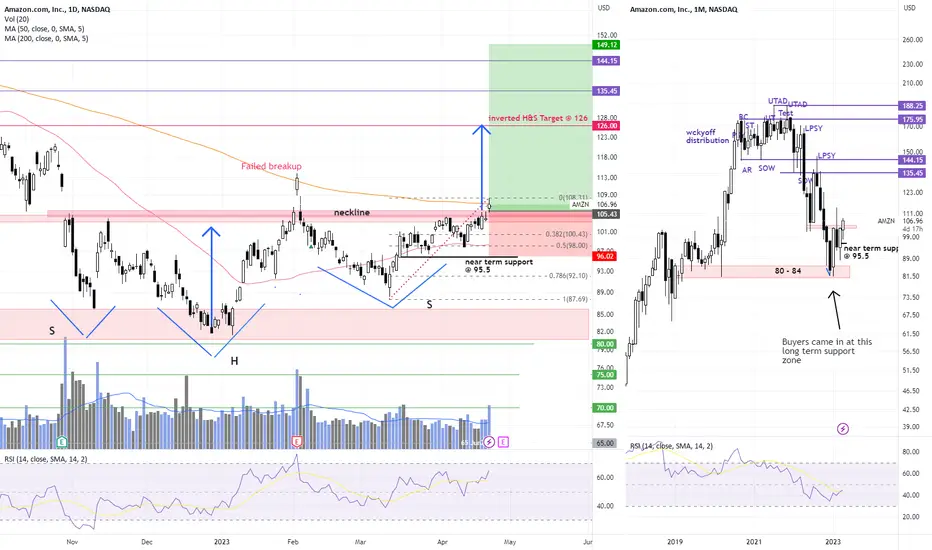
AMZN - inverted Head & ShouldersAMZN went through a complex Wckyoff Distribution that began from Sep2020, lasting more than a year before succumbing to the bear market of 2022.
Finally in Dec 2022 it dipped into a long term support area (80-84) and began to find support. The recovery since then has been choppy and an inverted head and shoulders (bottoming) formation began to take shape in this process.
Last Friday, AMZN finally broke above the neckline (zone 104-105.50) to close 106.96. Could this be another "false" breakup as it had happened earlier on 2nd Feb this year? We will not know for sure however the odds have improved with the formation of an inverted H&S formation (a bullish reversal pattern with good odds of success, though nothing is 100%).
With earnings expected on the 27th Apr, there is some risk taking a position now. However any dip going forward might find support around 95-06 region and could be opportunity to accumulate.
Let's see what happens after earnings!
Disclaimer: Just my 2 cents and not a trade advice. Kindly do your own due diligence and trade according to your own risk tolerance and don't forget that money management is important! "Let winners run and cut losses short". Take care and Good Luck!