GBP/CAD HEAD AND SHOULDERS BREAK OF NECKGoing to go down on the break of the neck line put on trail stop.
:)
Necklinebreak

SOFI - Are bulls in controls of this breakout?Looks like SOFI is possibly setting up for a breakout in the next 1-2 weeks. I am not giving any direction on which way I think it will go but I have plotted out possible levels of support/resistance that it could test in the near future.

BTC/USD Technical AnalysisAfter bitcoin gave an ATH, price has formed a head and shoulders (HS) formation and broke neckline and structure. I believe price will reach 52.000 area which also is the next major support area and should be a good take profit matching with the target of the HS formation.

ETHEREUM FINDING BULLISH MOMENTUM (LONG) or RSI Divergence?HI GUYS, I'M FIRST TIME POSTING ANALYSIS.
Ethereum (ETHUSD) 1 Hour timeframe -> Short formed W. This is a make or break level and indicates a higher low with strong bullish momentum.
The neckline of W can be a perfect entry ONLY WHEN price breaks the neckline (Black horizontal line - 3334) with strong momentum which will also result in 50-EMA breaking which indicates a strong buying level. The target will be a risk to reward of 1:2 which comes out to be 3463 (or you can exit at 3450 as well which was important support for previous days, so it can becomes strong resistance as well). Stop loss will be below neckline of Short formed W (3269)
Therefore only take entry when :
1. Strongly breaking horizontal resistance level (3334)
2. Breaking neckline and top of short W (same levels - 3334)
3. Breaking 50 day EMA strong
Once you have these 3 confirmations, you can take a trade and try for 200 EMA target as well while trailing stop loss.
RISKS OF TRADE : Conversely, if the current levels do not sustain, we can see sharp selling with RSI Divergence where the power/momentum of ETHUSD has increased at same price levels (3334). This means it is in overbought zone and will likely to fall till RSI gets a support or comes around 40-42.

BLZ seems to be short-term bearishThis is clearly a head and shoulders pattern forming up on the BLZ price chart. I will be expecting this to dump till reaching its golden ratio which is 0.176 range if it breaks the neckline and retests. Also depends on where BTC moves. Cuz in this situation, alts follow where BTC heading to.
Happy Trading!

USDCAD LONG IDEAOn the weekly chart, a double bottom was formed, neckline was broken then retested. On H4, this pair has been forming higher highs indicating that the pair is bullish. I'm looking to go long on this pair

EURUSD on H&S pattern 🦐EURUSD on the daily chart is testing the neckline of the H&S pattern created at the top of the bullish move.
The market after the 1.23400 high couldn't create higher highs and lost momentum and created a last retracement at 1.18900 before closing the week over the neckline.
According to Plancton's strategy if the market will break and retest the neckline we can set a nice short order.
––––
Follow the Shrimp 🦐
Keep in mind.
• 🟣 Purple structure -> Monthly structure.
• 🔴 Red structure -> Weekly structure.
• 🔵 Blue structure -> Daily structure.
• 🟡 Yellow structure -> 4h structure.
• ⚫️ Black structure -> >4h structure.
Here is the Plancton0618 technical analysis , please comment below if you have any question.
The ENTRY in the market will be taken only if the condition of the Plancton0618 strategy will trigger.

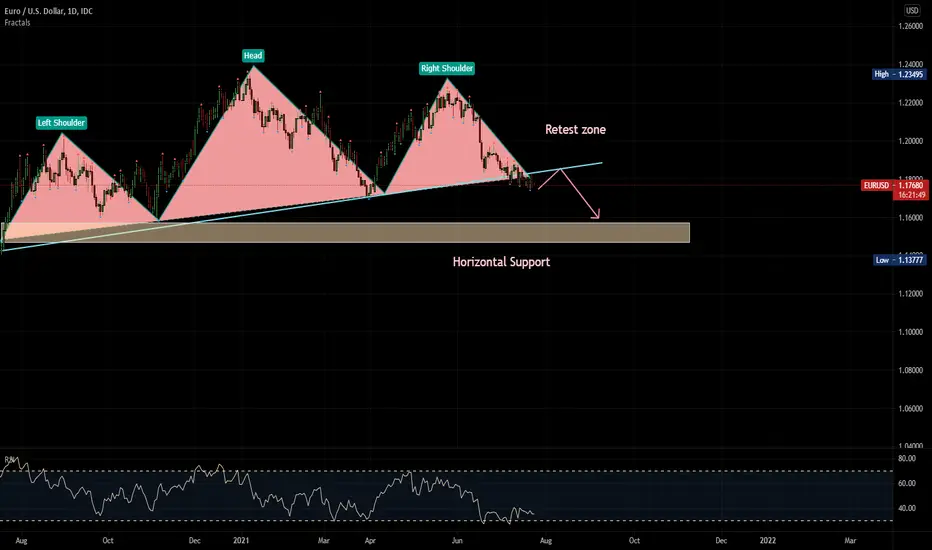
EURUSD MASSIVE HEAD AND SHOULDERSEURUSD pair seems it is formed a massive H&S pattern
And after the ECB rate decision If neckline breakout happens, we will see bearish continuation
And while the closest target is the horizontal support below
The scale of the pattern implies that the price might go much lower
Risk Disclosure: Trading Foreign Exchange (Forex) and Contracts of Difference (CFD's) carries a high level of risk. By registering and signing up, any client affirms their understanding of their own personal accountability for all transactions performed within their account and recognizes the risks associated with trading on such markets and on such sites. Furthermore, one understands that the company carries zero influence over transactions, markets, and trading signals, therefore, cannot be held liable nor guarantee any profits or losses.
NZD/USD multi time frame analysis - Possible Down MomentumPurple Line = Daily SNR/Trendline
Red Line = 4 Hour SNR/Trendline
Orange = 1 Hour SNR/Trendline
If this help you with your trading Please Like, Share and Follow that give me motivation to make another Trading Ideas
If you have some suggestion, comment or other opinion feel free to write it in comment
Wish you succesfull and consistent trading with profits!
This is not an investment advice.
"CFDs are complex instruments and come with a high risk of losing money rapidly due to leverage. Between 74-89% of retail investor accounts lose money when trading CFDs. You should consider whether you understand how CFDs work and whether you can afford to take the high risk of losing your money."

📚HOW TO EFFECTIVELY USE THE HEAD & SHOULDER PATTERN 📚Right here is the dynamic head and shoulder pattern and the steps to trade them when you spot them on the chart.
For Head and shoulder pattern to effectively work, we need the left shoulder and the head to complete first.
Then we will wait for price to fall back to the support horizontal line. Then if price doesn't break the support level downward, you enter a buy order and set your take profit where the right shoulder will form.
Also, if price does not break the resistance at the right shoulder, then we now have our H & S pattern.
We then sell again and take profit at the support.
Then if a downward breakout occur at the support, we wait for a retest back to the support zone to turn resistance. Then we sell again through the long tail.
THE SAME GOES FOR THE INVERSE H & S PATTERN.
What do you think?
Share your opinion in the comment section✍️
Please support this idea with a LIKE👍 if you find it useful🥳
Follow me to receive more updates on this pair🤙
Comment any coin you need my analysis or forecast on📈📉
Happy Trading💰🥳🤗
Thank you for your support!💓


💥ETHUSD - TO DIP TO $2200, THEN $1800As we can see on this chart, we have a downward trendline breakout from $2650 and a pull back is in play back to $2550 or the breakout point at $2650.
When price reach $2650, I expect price to dip to the neckline at $2220. If price, break the neckline downward, then I expect another dip to $1800.
What do you think?
Share your opinion in the comment section✍️
Please support this idea with a LIKE👍 if you find it useful🥳
Follow me to receive more updates on this pair🤙
Happy Trading💰🥳🤗
Trading Involves High Risk⚠️
Not Financial Advice💸
Use Proper Risk Management💹
Thank you for your support!💓

ADAUSD - LONG TO $2.30 (40% ROI FROM ENTRY)We have an ascending triangle with three credible support trendline on the chart.
Price retested the trendine and resulted into a bullish pin bar which indicates a long position incoming.
Therefore, I expect price to break the neckline upward and to continue in that direction.
What do you think?
Share your opinion in the comment section✍️
Please support this idea with a LIKE👍 if you find it useful🥳
Follow me to receive more updates on this pair🤙
Happy Trading💰🥳🤗
Trading Involves High Risk⚠️
Not Financial Advice💸
Use Proper Risk Management💹
Thank you for your support!💓
NB: If you would like to have one-on-one interaction with me about analysis of coins or currency, DM me.

VETUSD - LONG TO $0.22000 (77% ROI FROM ENTRY)The entry price, stop loss and take profits have been represented on this chart.
If you take a thorough look at this chart, you will see a lot of buy confirmation on this chart.
First we have the inverse head and shoulder.
Second, we have an upward trendine breakout and retest.
Thirdly, we have a support trendline uptrend continuation.
Therefore, if price does not break the horizontal yellow support line at $0.11974 downward, then I expect price to go long, break the neckline upward and continue to go long to the respective take profits.
What do you think?
Share your opinion in the comment section✍️
Please support this idea with a LIKE👍 if you find it useful🥳
Follow me to receive more updates on this pair🤙
Happy Trading💰🥳🤗
Trading Involves High Risk⚠️
Not Financial Advice💸
Use Proper Risk Management💹
Thank you for your support!💓
NB: If you would like to have one-on-one interaction with me about analysis of coins or currency, DM me.

💥CARDANO PERFECT BUY SETUP TO $2.30💥 CARDANO🔥
ADAUSDT BUY/LONG
Entry - $1.53 or market price
Tp1 - $1.78
Tp2 - $2.30
Stop loss - $1.31
REWARD✅ - It has potential of 15% - 50% ROI from entry
RISK - 15% from entry price
Apply risk management
As we can see, here is an inverse head and shoulder which confirms price to go long.
Therefore, I expect price to go long to the first target at $1.78 and if it breaks the neckline upward, I expect it to hit the second target at $2.30.
Once price hit the first take profit, wait for it to break the neckline upward, then buy again.
What do you think?
Share your opinion in the comment section✍️
Please support this idea with a LIKE👍 if you find it useful🥳
Follow me to receive more updates on this pair🤙
Happy Trading💰🥳🤗
Trading Involves High Risk⚠️
Not Financial Advice💸
Use Proper Risk Management💹
Thank you for your support!💓
NB: If you would like to have one-on-one interaction with me about analysis of coins or currency, DM me.

NKT A/S Inverse Head and ShouldersAn inverse head and shoulders on NKT that broke the neckline 48 hours ago. An acceleration to a new all time high took place the same day.
The next day showed much of the regain reverse, which is a worry as this engulfing candle could be a reversal sign.
However, watch price action over next couple of days to see how it shakes out or play it with a tight stop as the last decline of at the ATH was substantial (see yellow arrow - around 20%).
If this threat gets shaken off and the momentum continues then it could be a nice run up to more new highs.
The target for head and shoulders is typically the distance from the neckline to the head, so see the yellow measure of that which is added to itself to set the target.
Head and shoulders are just a pattern, they don't always work out, and i'm concerned about that engulfing red candle.

EURJPY | Short Term Perspective for the new weekWe enjoyed a 150pips run in our last publication before the price began to find higher highs (see link below for reference purposes) which topped @ Y133.4ish during last week trading session. Even as the EURJPY appears Bullish on the long-term outlook, the break below Key level @ Y132.800 which also serves as the Neckline of the Double Top structure signals a risk of further decline (a decline which may be considered temporary and in anticipation of a future rally) into Bullish Trendline indicated on the Daily chart (see chart below) for the Euro in the coming week(s).
In this regard, I shall be hoping to take a short term counter trend opportunity when the signal is duly confirmed!
Tendency: Temporary Downtrend (Bearish)
Structure: Breakdown | Supply & Demand | Reversal pattern (Double Top)
Observation: i. Since the successful break above Y132.800 on the 14th of May 2021, the price found a niche and remain "supported" above this level in the past week.
ii. The appearance of a Double Top which can be considered an extremely bearish technical reversal pattern forming after the price reached a peak @ Y133.400 two consecutive times with a moderate decline between the two highs signals a potential decline in price in the coming week.
iii. The Breakdown of Bullish Trendline which also coincides with Breakdown of Neckline @ Y132.800 during the early hours on Friday appears to be a strong indication that supports a build in momentum for the Bears.
iv. With a new Supply level identified on the chart at around Y132.7000/133.000; the retest of Key level (Neckline) @ Y132.800 shall be my yardstick for selling opportunity in the coming week(s).
v. I suspect a Correction move of the Bullish run that was initiated on the 22nd of April 2021 (see Daily chart below) is about, to begin with, the aim of testing the Bullish Trendline (see Daily chart below) with high anticipation of a rally continuation in the nearest future... Trade consciously!
Trading plan: SELL confirmation with a minimum potential profit of 150 pips.
Risk/Reward : 1:6
Potential Duration: 4 to 10 days
NB: This speculation might be considered to make individual decisions on the lower timeframe.
Watch this space for updates as price action is been monitored.
Risk Disclaimer:
Margin trading in the foreign exchange market (including foreign exchange trading, CFDs, etc.) has a high risk and is not suitable for all investors. The content of this speculation (including all data) is organized and published by me for the sole purpose of education and assistance in making independent investment decisions. All information herein is for your reference only and I take no responsibility.
You are hereby advised to carefully consider your investment experience, financial situation, investment objective, risk tolerance level, and consult your independent financial adviser as to the suitability of your situation prior to making any investment.
I do not guarantee its accuracy and is not liable for any loss or damage which may result directly or indirectly from such content or the receipt of any instruction or notification therewith.
Past performance is not necessarily indicative of future results.

GBPCAD > Ridiculously Useful Setup for Possible 157 Pips!I hope you are feeling generous and loving today to give me a like and leave a comment it will really support the creation of new free ideas for you.
Analysis on #GBPCAD
Hello friends.
the market here seemed to be bottoming and it might be forming a triangle here but it doesn't meet the rules so i can't take it, however here is my plan:
>> if the market breaks and closes above the neckline then drop a one-time frame looking for a valid reason to get in a long trade for a possible 157 pips for a target.
Safe trading everyone
Check today analysis below⠀
>> “Control Your Emotion and You Control Your money.”
_____________________________________________________________________________⠀
-Disclaimer: This information is not a recommendation to BUY or SELL. It is to be used for educational purposes only⠀
-Please note this is just a PREDICTION and I have no reason to act on it and neither should you

AUDUSD Intraday BuyThroughout the day, AUDUSD has been forming nothing but higher highs and higher lows.
It has also broken above 0.7786, a neckline to the previous 2 lows.
In any case, sellers are definitely looking very weak and buyers will be able to take over easily as it now finds support at the bottom of a rising channel.

gbpusd bullish impulseThe trend is quite extended.
Im going to apply strict risk management on this idea. SL to Break even after a 1:1 ratio has been attained.
Executing the trade upon evidence of a reversal candlestick pattern from the demand levels.

Gold Bullish run update.
Following our successful entry and Target hit, we see another opportunity for the bullish run continuation.
Caution because pair is currently gathering more sell orders to trap retail seller.
Expect aggressive stop hunts to the downside, but based on probabilities we are bullish until further price action

Wait for a break of the S/R line before entering Gold (XAUUSD)Enter on the retest of the horizontal support resistance line. Potential entries for a buy are 1745.355 and 1760.754.

BABA Head and Shoulders- Watch for break in supportA head and shoulders pattern has formed on Alibaba and the neckline is perfectly aligned with the firmly established support line that has been tested numerous times since October 2018. The head and shoulders pattern on BABA has been forming since September 2019 and if the neckline/support is broken I think we could see a very significant drop from here.
