NEIRO/USDT On the Edge of a Breakout
🔍 Full Technical Analysis (1D Timeframe)
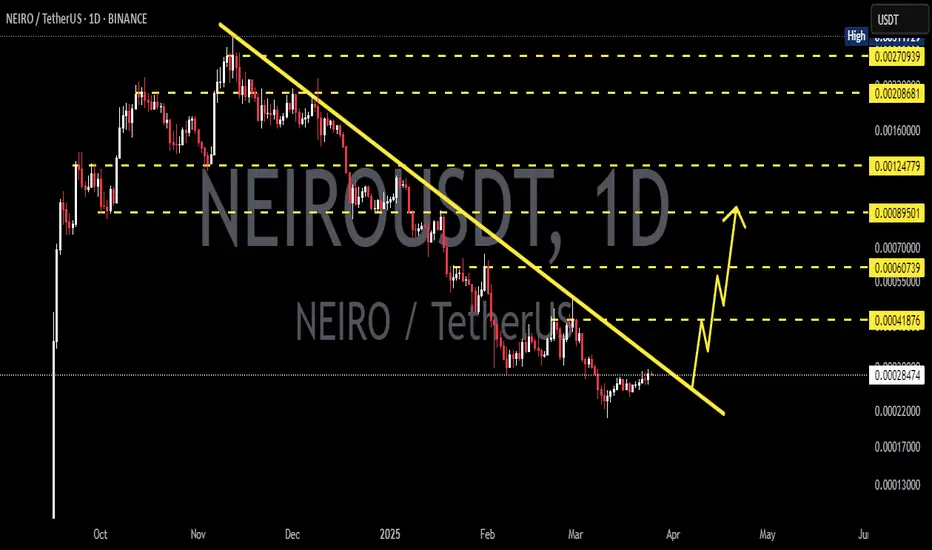
NEIRO/USDT is currently in a highly critical and potentially explosive phase. After a strong downtrend that began in late 2024, the price has entered a structured Falling Channel (Downward Parallel Channel) that has lasted for over 2 months.
This pattern often represents a quiet accumulation phase, where smart money prepares for the next big move — and right now, all eyes are on a potential bullish breakout.
🧩 Market Structure & Chart Pattern
📐 Falling Channel
Parallel support and resistance lines sloping downward.
Price has tested the upper boundary multiple times, building pressure toward a breakout.
🔍 Volume Analysis
Volume is decreasing as price nears the end of the channel — a classic sign of an impending breakout.
⚠️ Breakout Watch
A breakout above the upper channel resistance (~0.00045 USDT) could lead to a multi-phase rally.
📈 Bullish Scenario (Breakout Confirmation)
If the price breaks above the upper boundary and confirms the breakout with strong volume, the following targets come into play:
1. 🔹 First Target:
0.00052438 USDT – The initial horizontal resistance.
2. 🔹 Second Target:
0.00061749 USDT – A previously broken support, likely to be retested.
3. 🔹 Major Target:
0.00090443 USDT – A strong resistance zone from a past distribution range.
4. 🎯 High Target Zone:
0.00273117 – 0.00311729 USDT – A historical supply zone and possible long-term target.
> ✅ Confirmation Needed: Valid breakout must be accompanied by strong volume, a daily candle close above the channel, and preferably a successful retest of the breakout level.
📉 Bearish Scenario (Failed Breakout / Rejection)
If the breakout fails and price gets rejected:
Price may fall back to the lower channel support near 0.00035 – 0.00037 USDT.
A breakdown below this range could push price toward:
0.00027 USDT
0.00013878 USDT (key historical support and cycle low)
This would indicate that accumulation is not yet complete and sellers still control the market.
📊 Strategic Summary
> NEIRO is approaching the end of a well-defined falling channel, setting up for a potential bullish breakout. If successful, the structure of the market provides multiple levels for profit-taking. However, validation through breakout confirmation and risk management is essential.
⏳ Watch daily candle closes and volume closely!
📌 Trading Plan Summary
✅ Buy on breakout and retest of channel resistance
🛑 Stop loss: Below invalidation levels or channel support
🎯 Targets: 0.000524 – 0.000617 – 0.000904 – 0.0027+
#NEIROUSDT #NEIRO #CryptoBreakout #AltcoinSetup #FallingChannel #BullishPattern #CryptoTechnicalAnalysis #BreakoutTrade #Altseason2025
Neirousdtsignals

NEIRO – Re-Entering for Continuation Toward Yearly OpenGiving BINANCE:NEIROUSDT another shot at a long. (Last one was a great one)
Caught the first impulse move, and now looking for continuation into the Yearly Open.
Starting to bid here and will stay patient this week— Mostly dependent on CRYPTOCAP:ETH reclaiming the 2900–3000 zone.
That reclaim would shift my outlook entirely and increase the probability of new highs.
Longing here for now, with eyes on confirmation soon.

NEIROUSDT 1D AnalysisNEIRO ~ 1D Analysis
#NEIRO This trade is very high risk
Buy after successfully breaking through this resistance line with large volume, minimum target 15%++

NEIRO/USDT (4H) – Double Bottom Breakout Setup NEIRO/USDT (4H) – Double Bottom Breakout Setup
Pattern: Double Bottom 🔁
Timeframe: 4-Hour ⏱️
Pair: NEIRO/USDT 💱
Published: June 09, 2025 📅
Technical Overview:
NEIRO/USDT is forming a clean double bottom pattern, which often signals a potential reversal after a sustained downtrend. The price has established a solid support zone around 0.00037500 to 0.00038500 and is now approaching the neckline resistance near 0.00043500. A descending trendline has also been broken, suggesting a shift in momentum from bearish to bullish 📈.
Potential Trade Setup:
Bullish Scenario ✅
Entry: On a confirmed breakout and close above 0.00043500 to 0.00044000
Targets:
* First target at 0.00049000 🎯
* Second target at 0.00053000 🎯
Stop-loss: Below 0.00040500 🛑
Risk Management ⚠️
If the price gets rejected at the neckline and falls back below 0.00038500, the pattern becomes less reliable. Watch for increased volume on breakout for confirmation 📊.
Conclusion:
This setup indicates early signs of a trend reversal. A successful breakout above the neckline could lead to upward continuation with strong momentum. Patience and confirmation are key before entering 🔍📈.

NEIROUSDT 1DNEIRO ~ 1D Analysis
#NEIRO Trading is very high risk. Buy after successfully penetrating this resistant line with a short -term target of at least 10%+.
NEIROUSDT 1DNEIRO ~ 1D Analysis
#NEIRO This trade is very high risk. But if you still have a Conviction on this coin. Buy after successfully penetrating this resistant line, with a short -term target of at least 15%+

NEIROUSDT 1DNEIRO ~ 1D
#NEIRO If you still have Conviction on this coin,. Buy gradually on this support block,. with a minimum target of 15%++

NEIROUSDT 1DNEIRO ~ 1D
#NEIRO This is a very important support block for this meme coin,.if you still have Conviction on this coin,. Buy in stages from here. with a short term target of at least 20%+

NEIRO /USDT : gearing up for breakout above trendline resistanceNEIRO/USDT: Gearing Up for a Breakout Above Trendline Resistance
NEIRO/USDT is setting the stage for an exciting breakout 📈 as it approaches a critical trendline resistance zone 📊. The price has been consolidating tightly, forming a solid setup for a potential bullish move 💥. If the breakout occurs, this pair could embark on a strong upward rally 🚀. Stay alert 👀 and wait for confirmation before taking action.
Key insights:
1. Trendline resistance: NEIRO/USDT is nearing a significant trendline that has acted as a barrier in previous attempts. A break above this level could signal the start of a strong bullish trend.
2. Volume surge: Monitor trading volume closely. A sharp increase during the breakout could confirm strong buyer momentum 🔥.
3. Bullish signals: Technical indicators such as RSI and MACD are displaying positive momentum ⚡, aligning with the potential for a bullish breakout.
Steps to confirm the breakout:
Look for a decisive 4H or daily candle closing above the trendline 📍.
Confirm the move with a noticeable spike in trading volume, indicating strong buying activity 📊.
A retest of the broken resistance as a new support zone further validates the breakout ✅.
Be cautious of false breakouts, which can include wicks above the trendline or quick reversals ⚠️.
Risk management strategies:
Utilize stop-loss orders to protect your position and manage risk effectively 🔒.
Ensure your position size aligns with your overall trading plan 🎯.
This analysis is for educational purposes only and does not constitute financial advice. Always perform your own due diligence (DYOR) 🔍 before making any investment decisions.

NEIROUSDT 8HNEIRO ~ 8H
#NEIRO If you still have Conviction on the coin,. Buy gradually within this support block,. we think a retest of this support will be a nice bounce. short term target of at least 15%+ from here.

NEIROUSDT Trade the Triangle break-outsNEIRO (NEIROUSDT) has been trading within a Triangle pattern since the September 10 All Time High (ATH). The 1D MA50 (blue trend-line) is almost in the middle of it, so the trend will be neutral and sideways as long as the price keeps trading within.
Our suggestion is to trade to the direction of the break-out that takes place first. If it will be above the pattern (Lower Highs), buy and target the 2.0 Fibonacci extension at 0.2200. If below the pattern (Higher Lows), sell and target the -1.0 Fib ext at 0.0310.
-------------------------------------------------------------------------------
** Please LIKE 👍, FOLLOW ✅, SHARE 🙌 and COMMENT ✍ if you enjoy this idea! Also share your ideas and charts in the comments section below! This is best way to keep it relevant, support us, keep the content here free and allow the idea to reach as many people as possible. **
-------------------------------------------------------------------------------
💸💸💸💸💸💸
👇 👇 👇 👇 👇 👇
