XEM completing final leg of bullish Butterfly for upto 15% moveOn one hour chart, the price action of NEM (XEM) is completing the final leg of bullish Butterfly pattern, soon it will be entered in a potential reversal zone.
Buying And Sell Targets:
The buying and sell targets according to harmonic Butterfly pattern should be:
Potential reversal or buying zone: $0.2245 to $0.2154
Fibonacci projection or sell zone: $0.2315 to $0.2485
Stop Loss:
The potential reversal zone area that is up to $0.2154 can be used as stop loss in case of complete candlestick closes below this level.
Possible profit and loss ratio:
As per above targets this trade has a profit possibility of 15% and as per the above-mentioned stop loss, the loss possibility is 4.10%.
Note: Above idea is for educational purpose only.
Nemusd

XEM NEM Easy Targets - NEMXEM XEMBTC XEMUSDT XEMUSD XEMETHXEM NEM Easy Targets - NEMXEM XEMBTC XEMUSDT XEMUSD XEMETH

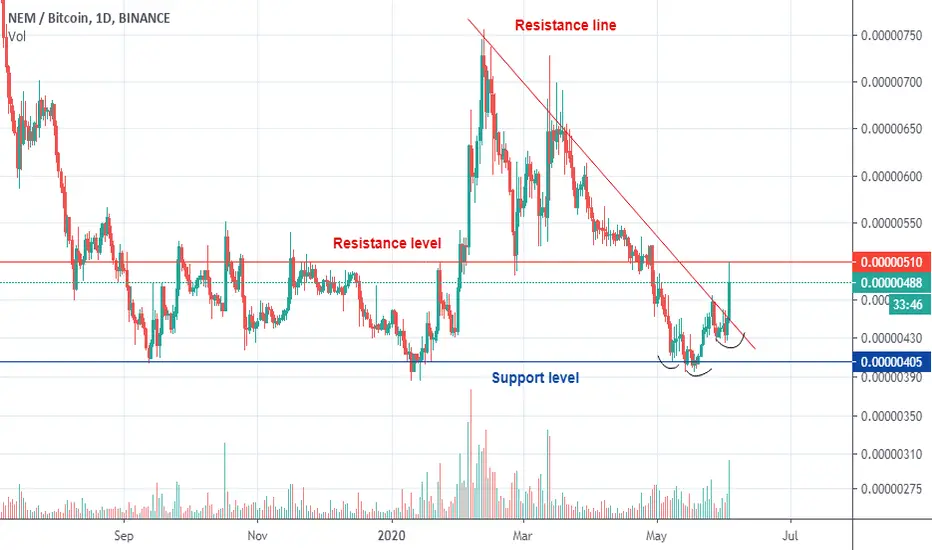
Bullish momentum XEM/BTC, but wait.Hello Traders,
XEM/BTC apparently did an inverted head and shoulders after a reversal on important support level and now breaks the resistance line on the uptrend direction, but wait for, we are now going to test a resistance zone, the right thing to do in this asset is waiting for some bullish accumulation pattern at this level and entry on the next breakout.
Please push like and follow us on Tradingview
$$$XEM$$$Hi All !!! XEM is looking interesting here ! If this 4 hourly and daily candle can finish above $0.045, will possibly find its new support there and there could be a breakout soon !!!
Cheers !!! Happy Trading !

NEM/USD lags behind with growthtop altcoin growth made its way.
NEM lags behind with growth (idea)
There was a way out of the triangle.
Testing of the breakdown zone was.
Stop loss on the red dotted line.
Entrance after the green line breakage. ( Safe )
Push ❤️ if you think this is a useful idea!
Before to trade my ideas make your own analysis.
Thanks for your support!

NEM bull wedgethe purchase was completed, we follow the scenario - today the shot is 666 - 750 to target 900

XEM needs a close over $0.045......then long.
hint: Catapult Mainnet ;) NEM2 / Zaif#Japan + CAT / NEM Foundation#World


There is a trading opportunity to buy in NEMUSDTechnical analysis:
. NEM/US Dollar is in a range bound and the beginning of uptrend is expected.
.The price is above the 21-Day WEMA which acts as a dynamic support.
. The RSI is at 85.
Trading suggestion:
. There is a possibility of temporary retracement to suggested support zone (0.0575 to 0.0455). if so, traders can set orders based on Price Action and expect to reach short-term targets.
Beginning of entry zone (0.0575)
Ending of entry zone (0.0455)
Entry signal:
Signal to enter the market occurs when the price comes to " Buy zone " then forms one of the reversal patterns, whether " Bullish Engulfing ", " Hammer " or " Valley " in other words, NO entry signal when the price comes to the zone BUT after any of reversal patterns is formed in the zone. To learn more about " Entry signal " and the special version of our " Price Action " strategy FOLLOW our lessons :
Take Profits:
TP1= @ 0.0784
TP2= @ 0.1079
TP3= @ 0.1330
TP4= @ 0.1982
TP5= @ 0.2765
TP6= @ 0.3595
TP7= @ 0.4526
TP8= @ 0.7147
TP9= @ 1.1387
TP10= Free

NEM/US DollarNEMUSD at EMA50 Weekly chart-
Disclaimer:
We are not registered or licensed in any jurisdiction whatsoever to provide investing advice or anything of an advisory or consultancy nature,
and are therefore are unqualified to give investment recommendations.
Always do your own research and consult with a licensed investment professional before investing.
This communication is never to be used as the basis of making investment decisions, and it is for entertainment purposes only.

This caterpillar will become a beautiful butterfly?since we know that all XEM users will receive 1 to 1 catapult tokens, and at the same time, the XEM network will continue to function, we come to the conclusion that a bearish trend will end soon
Paired with the dollar, we can see consolidation.
If in the next month, there will be no catch from Bitcoin, we should see a breakthrough, a falling wedge
The caterpillar will again become a butterfly

NEM/BTC possible moves
This is the few Alts which no one is talking about, also the best coin to gain profits as in every short bull run this coin has performed
quite well.
Nem/Btc formation of positive divergence, wait for entry around the support area.

XEMUSD formed bullish BAT |Upto 145% expectedPriceline of NEM / US Dollar has formed a bullish BAT pattern and entered in potential reversal zone to hit the sell targets soon insha Allah.
But Volume profile of complete pattern is showing that traders are still interested to trade below the PRZ area and MACD is still bearish moreover the Stochastic is oversold but did not give bull cross sofar, so for secure trade we can we can wait for MACD to turn weak bearish or stochastic to give bull cross then buy.
I have used Fibonacci sequence to set the targets:
Buy between: 0.05332389 to 0.04410869
Sell between: 0.07502190 to 0.10839231
Regards,
Atif Akbar (moon333)

Top 15 Crypto By Market Cap ($LTC the winner YTD)No doubt, the recent rally has everyone fired up about longstanding assets BTC, BCH, ETH, but have you taken a look at LTC recently? More than 200% with not a ton of fundamentals driving it.

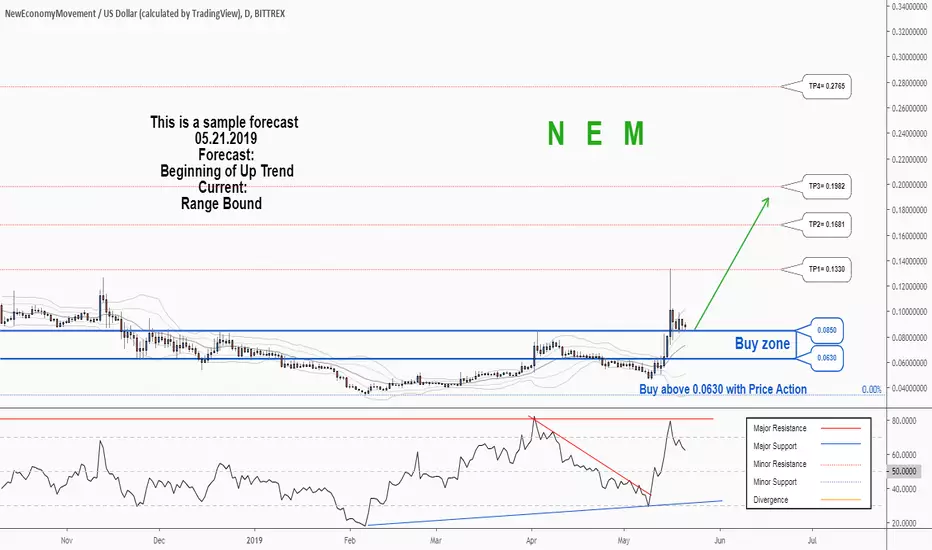
There is a possibility for the beginning of an uptrend in NEMUSDTechnical analysis:
. NEM/Dollar is in a range bound and the beginning of uptrend is expected.
. The price is above the 21-Day WEMA which acts as a dynamic support.
. The RSI is at 56.
Trading suggestion:
. There is a possibility of temporary retracement to suggested support zone (0.0850 to 0.0630). if so, traders can set orders based on Price Action and expect to reach short-term targets.
Beginning of entry zone (0.0850)
Ending of entry zone (0.0630)
Entry signal:
Signal to enter the market occurs when the price comes to " Buy zone " then forms one of the reversal patterns, whether " Bullish Engulfing ", " Hammer " or " Valley " in other words,
NO entry signal when the price comes to the zone BUT after any of the reversal patterns is formed in the zone.
To learn more about " Entry signal " and the special version of our " Price Action " strategy FOLLOW our lessons:
Take Profits:
TP1= @ 0.1330
TP2= @ 0.1681
TP3= @ 0.1982
TP4= @ 0.2765
TP5= @ 0.3686
TP6= @ 0.4567
TP7= @ 0.7177
TP8= @ 1.1405
TP9= Free
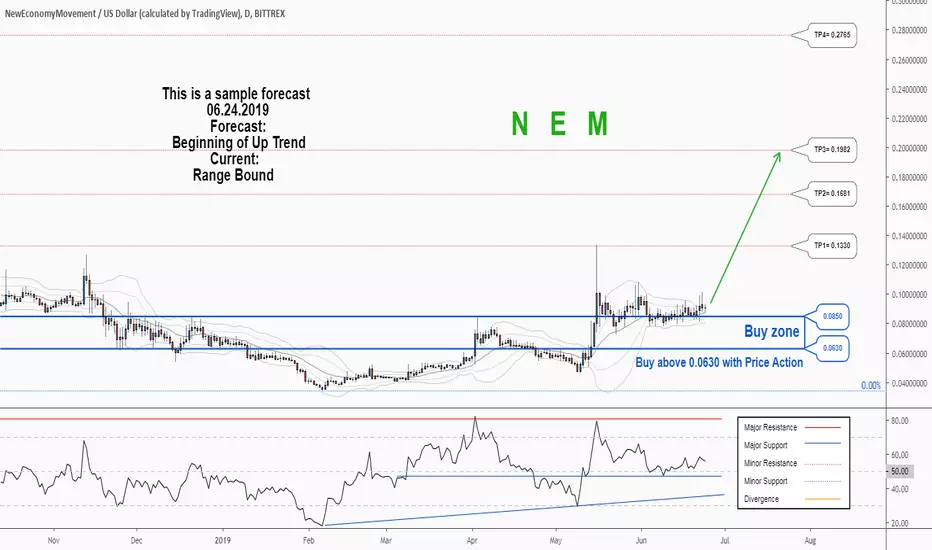

Imminent breakout due bullish pennant and divergence Hello fellow traders,
not much to say, one may expect a target between 0.11 and 0.12 if the pennant plays out (blue paths), probably it's going a lot higher mid term if it breaks the ascending triangle (violet paths).
See the attached longterm projection of XEM which has been quite accurate for 1.5 months.
One may buy in now but I suggest to wait for another bounce of the pennants support.
So the target price for a buy is between 0.082 and 0.084.
My advice is to buy in in steps of 20% or 25% of your planned allocation over the next few days.
Which should be between 10% and 15% of your equity.
Im not a professional financial consultant, so this is for educational purpose only.
Trade safe

G20. Director and Co-founder of NEM Ventures, said :
June 9 G20 meeting in Fukuoka, Japan, the G20 finance ministers, and central bank governors filed a request with the Financial Stability Board (FSB) to monitor cryptoassets-associated risks.
Finance ministers and central bank chiefs from the Group of 20 (G20) major economies asked international organizations, including the International Organization of Securities Commissions (IOSCO), Financial Action Task Force (FATF), and the Financial Stability Board (FSB), to consider working on additional multilateral responses as needed, and showed support to the ‘draconian’ KYC-related suggestions that would affect virtual asset service providers and their clients.
The regulators said crypto assets do not pose a threat to global financial stability at this moment, but they shall remain vigilant to risks related to consumer and investor protection, anti-money laundering and countering the financing of terrorism.
Dave Hodgson, Director and Co-founder of NEM Ventures, said that the FSB’s analysis of decentralised financial technologies and regulatory challenges is encouraging, adding that he looks forward to more concrete recommendations in the future. He said:
“It would be beneficial to hear from the FCA in the UK and the SEC in the US as they have thus far been quiet on their preferred approach. As a result, companies have been reliant on self regulation combined with hefty punishments in these jurisdictions for those who have fallen victim to this regulatory uncertainty.
It is also critical to consider the role that proactive regulators such as Gibraltar, Malta, Bermuda, Switzerland, and Germany will play – as regulatory certainty will allow the population to operate how it wishes, while being legally compliant.”
The joint Communiqué says:
“Technological innovations, including those underlying crypto-assets, can deliver significant benefits to the financial system and the broader economy.”
However, after optimism, the authors of the paper raised concerns over new technologies saying:
“While crypto assets do not pose a threat to global financial stability at this point, we remain vigilant to risks, including those related to consumer and investor protection, anti-money laundering (AML) and countering the financing of terrorism (CFT).”
Except for the risks, the document notes that there are also benefits of blockchain for the economy:
“Technological innovations, including those underlying crypto-assets, can deliver significant benefits to the financial system and the broader economy.”
The G20 leaders reaffirmed their commitment to applying the recently amended FATF Standards to virtual assets and related providers for Anti-Money Laundering (AML) and Counter-Financing of Terrorism (CFT).
“We look forward to the adoption of the FATF Interpretive Note and Guidance by the FATF at its plenary later this month.”

There is a possibility for the beginning of an uptrend in NEMUSDTechnical analysis:
. NEM/Dollar is in a range bound and the beginning of uptrend is expected.
. The price is above the 21-Day WEMA which acts as a dynamic support.
. The RSI is at 63.
. The RSI downtrend is broken, so the probability of the resumption of an uptrend is increased.
Trading suggestion:
. There is a possibility of temporary retracement to suggested support zone (0.0850 to 0.0634). if so, traders can set orders based on Price Action and expect to reach short-term targets.
Beginning of entry zone (0.0850)
Ending of entry zone (0.0634)
Entry signal:
Signal to enter the market occurs when the price comes to " Buy zone " then forms one of the reversal patterns, whether " Bullish Engulfing ", " Hammer " or " Valley " in other words,
NO entry signal when the price comes to the zone BUT after any of the reversal patterns is formed in the zone.
To learn more about " Entry signal " and the special version of our " Price Action " strategy FOLLOW our lessons:
Take Profits:
TP1= @ 0.1330
TP2= @ 0.1681
TP3= @ 0.1982
TP4= @ 0.2765
TP5= @ 0.3686
TP6= @ 0.4567
TP7= @ 0.7177
TP8= @ 1.1405
TP9= Free