NEO GOING TO $35Neo is one the good support and i see the revers head and shoulder and just break the Head so we can expect to see $35 for Midterm
Not Finacial advice
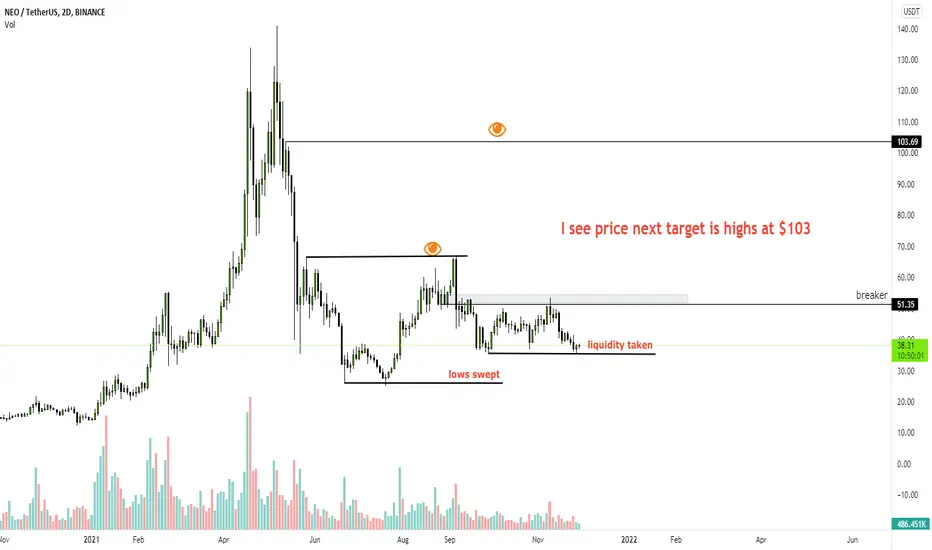
Keep EYE ON NEO
NEO

NEO - Welcome To The Matrix From first look at this chart it can be overwhelming... But let us explain.
We look to be in a descending channel and respecting it well. It could be that we bounce from the current level back up to the 66 level. However, if we reject the channel resistance, we could make our way back to the 12 to 16 level where the 2021 bull run started. That would make for a great retest before moving higher.
Now that we have all the possible moves marked out, we just need to wait for one of the scenarios to play out and act accordingly.
In the meantime we can watch for a break of the descending trendline and target the channel resistance and then see how we react there before we either enter shorts back to the impulse generation level OR we hold our longs to the 66 level.
Goodluck!

NEO (NEO) - December 8Hello?
Welcome, traders.
If you "follow", you can always get new information quickly.
Please also click "Like".
Have a nice day.
-------------------------------------
(NEOUSD 1W Chart)
Above the 23.66260578 point: the uptrend expected to continue.
A break from the downtrend line is expected to accelerate the uptrend.
Therefore, I think it is good to proceed with the investment from a mid- to long-term investment point of view.
It should move above the 79.90498226 point to accelerate the uptrend.
------------------------------------------
(NEOBTC 1W chart)
Above 0.002743 point: Expected to create a new wave.
The interval 0.000828-0.001672 is the box interval from the bottom interval.
------------------------------------------
We recommend that you trade with your average unit price.
This is because, if the price is below your average unit price, whether the price trend is in an upward trend or a downward trend, there is a high possibility that you will not be able to get a big profit due to the psychological burden.
The center of all trading starts with the average unit price at which you start trading.
If you ignore this, you may be trading in the wrong direction.
Therefore, it is important to find a way to lower the average unit price and adjust the proportion of the investment, ultimately allowing the funds corresponding to the profits to be able to regenerate themselves.
------------------------------------------------------------ -------------------------------------------
** All indicators are lagging indicators.
Therefore, it is important to be aware that the indicator moves accordingly with the movement of price and volume.
However, for convenience, we are talking in reverse for the interpretation of the indicator.
** The MRHAB-O and MRHAB-B indicators used in the chart are indicators of our channel that have not been released yet.
(Since it was not disclosed, you can use this chart without any restrictions by sharing this chart and copying and pasting the indicators.)
** The wRSI_SR indicator is an indicator created by adding settings and options to the existing Stochastic RSI indicator.
Therefore, the interpretation is the same as the traditional Stochastic RSI indicator. (K, D line -> R, S line)
** The OBV indicator was re-created by applying a formula to the DepthHouse Trading indicator, an indicator disclosed by oh92. (Thanks for this.)
** Support or resistance is based on the closing price of the 1D chart.
** All descriptions are for reference only and do not guarantee a profit or loss in investment.
(Short-term Stop Loss can be said to be a point where profit and loss can be preserved or additional entry can be made through split trading. It is a short-term investment perspective.)
---------------------------------


NEO USD - Long
NEO USD
Elliot wave Analysis .
NEO is going to drop further from this point to complete its final wave before big move up .
Long at 21 $
Stop loss at 16$ .

NEO to $90 Confirmed!!Neo has broken yearly resistance at $23 and has broken another resistance today and is ready to move higher.
Always manage risk in all trades.
Risk management helps cut down losses. It can also help protect traders' accounts from losing all of its money. The risk occurs when traders suffer losses. ... After all, a trader who has generated substantial profits can lose it all in just one or two bad trades without a proper risk management strategy.

NEO all set for the next big moveHi,
I'm sharing my thoughts on neo. I think neo will target the highs which is still untapped.
Keep an eye on neo and stay focused.

NEO (NEO) - November 19Hello?
Welcome, traders.
If you "follow", you can always get new information quickly.
Please also click "Like".
Have a nice day.
-------------------------------------
(NEOUSD 1W Chart) - Mid-Long-Term Perspective
Above the 23.66260578 point: the uptrend expected to continue
Above 50.22168635 point: Expected to create a new wave.
(1D chart)
First resistance zone: near 62.85235308
Second resistance section: 81.99678728-91.56900384
Support section: 34.13570235-43.70791888
You need to see if you can move along the uptrend line while holding the price in the support zone.
It needs to move above the 55.62236728 point to continue the uptrend.
To accelerate an uptrend, you need to break out of the downtrend line.
A decline from the 34.13570235 point could lead to a fall below the 23.66260578 point, so we need to think about how to deal with it.
------------------------------------------
(NEOBTC 1W chart)
The 0.000828-0.001672 section is a sideways section for ascent.
Therefore, if the 0.000828-0.001672 section continues to converse, it is expected to turn into an uptrend.
------------------------------------------
We recommend that you trade with your average unit price.
This is because, if the price is below your average unit price, whether it is in an uptrend or in a downtrend, there is a high possibility that you will not be able to get a big profit due to the psychological burden.
The center of all trading starts with the average unit price at which you start trading.
If you ignore this, you may be trading in the wrong direction.
Therefore, it is important to find a way to lower the average unit price and adjust the proportion of the investment, ultimately allowing the funds corresponding to the profits to regenerate themselves.
------------------------------------------------------------ -----------------------------------------------------
** All indicators are lagging indicators.
Therefore, it is important to be aware that the indicator moves accordingly as price and volume move.
However, for the sake of convenience, we are talking in reverse for the interpretation of the indicator.
** The MRHAB-O and MRHAB-B indicators used in the chart are indicators of our channel that have not been released yet.
(Because it is not public, you can use this chart without any restrictions by sharing this chart and copying and pasting the indicators.)
** The wRSI_SR indicator is an indicator created by adding settings and options to the existing Stochastic RSI indicator.
Therefore, the interpretation is the same as the traditional Stochastic RSI indicator. (K, D line -> R, S line)
** The OBV indicator was re-created by applying the formula to the DepthHouse Trading indicator, an indicator disclosed by oh92. (Thanks for this.)
** Support or resistance is based on the closing price of the 1D chart.
** All descriptions are for reference only and do not guarantee a profit or loss in investment.
(Short-term Stop Loss can be said to be a point where profit and loss can be preserved or additional entry can be made through split trading. It is a short-term investment perspective.)
---------------------------------

NEO Big Rise - Point ComparisonThis is a simple two point comparison between parts of the large bullrun and parts of the current bullrun
It can be seen that a massive move is missing as of current for us
This comparison can also be placed on LTCUSD which is another idea I will attach below, maybe a correlation between the two coins?

💂🏻CryptoSoldier💂🏻 NEO Small Trade💂🏻 Small breakout of major volume zone, then retest and we jump into train.
📈 Spot Trade: Long NEO
⚠️ SL: -
🏅 TP: -
⏳ Time aprox: -
💂🏻If you agree this Trade hit the like button.
💂🏻Si estas de acuerdo deja tu like.

NEO ANALYSIS 🔎To this week i really pay attention to best condition coins , Neo is the one of best condition coins and you can check my analysis and buy NEO for short term or hold it for long term ...
NEO have a bad resistance in 60 to 65 and it breakout soon !!
Before do any thinks first search about that and look to your analysis and if all things have not problem NEXT buy .
Have a good times :)


Neo LongNeo
Everything on the chart
Entry : Market price (Best point is 44$ ~ 40$)
TP1 : 92$
TP2 : 140$
TP3 : 200$ ATH
Stop Loss : 34$ ~ 31$
Good Luck

XLM First Target SecuredSo if we focus closely here, we can see XLM really consolidating for Higher highs. And we honestly believe they will be well worth the HODL/Accumulation.
Currently it looks like XLM is battling .33-.37 pretty vehemently. If it can break through and hold a steady beat through even the .44 range, XLM will start a new leg up to its higher-highs.
Keep an eye out for traps. RSI cannot be too high when ATH is in sights. The same is true for Volume and low RSI on sell-off. Don't get caught.
Never advice. Just m00n thoughts.
3 days ago - www.fxstreet.com

₿ NEOUSDT 1D ₿ : 12.Nov.2021#NEO has reached a good support range again ... Keep an eye on NEO ...
Follow our other analysis & Feel free to ask any questions you have, we are here to help.
⚠️ This Analysis will be updated ...
👤 Arman Shaban : @Ar_M_An_4
📅 12.Nov.2021
⚠️(DYOR)

₿ DOGECOIN 1D ₿ : 10.Nov.2021Selling #DogeCoin at this price is pure stupidity :))) I can not say anything clearer than this , hold it up to at least 70 cents.
and if you don't have it , buy some ... at least 15% of your portfolio ...
Follow our other analysis & Feel free to ask any questions you have, we are here to help.
⚠️ This Analysis will be updated ...
👤 Arman Shaban : @Ar_M_An_4
📅 10.Nov.2021
⚠️(DYOR)

NEOUSDT Breakout, Nov 10There is no doubt that Neo is one of the best projects
Downward trend is broken, I expect a Higher high somewhere around $74 and when it hit that price, it means that the resistance is broken so the next price target would be ATH


Tesla poised for further downside at open tomorrow . Looking for a pullback to fill the gap in the 925 area for possible entry. Nothing fancy here. Just people selling the news and a gap up that statistically needs to be filled.

NEOUSDT Technical Analysis⏳ Spot
💎 NEOUSDT after breaking above the triangle and a major resistance, it went for a retest at the support zone it has got rejected so I expect that soon we see another Bullish impulsive leg
🌐 Tradingview
💵 Invest Only 5% of your Portfolio
🎳 Entry Now or from 47.49 to 51.80
☕️ TP1 55.57
🍺 TP2 61.64
🍻 TP3 68.18
🍾 TP4 74.52
🍷 TP5 80.00
🍸 TP6
🍹 TP7
🎁 TP8
🚫 SL 43.00 to 47.49
Good Luck 🎲
Check the Links in Description and If you LIKE this analysis, Please support our page and Ideas by hitting the LIKE 👍 button. ❤️ Your Support is really appreciated! ❤️
Traders, if you have your own opinion about it, please write your own in the comment box. We will be glad for this.
Feel free to request any pair/instrument analysis or ask any questions in the comment section below.
We will have more FREE forecasts in TradingView soon
Have a profitable day 😊👍🏻

NEOUSDT is testing the important resistance area After very long time accumulation NEOUSDT started to move with the old big coins like EOS, ETC, LTC, DASH etc... THe first test spot point was 48usdt and passed with the market movement. But from other hand NEO is still weak as NEOBTC. Now price has to surge 53.50 -54 usdt spot and next targets will be as on the graph. ( 67 usd and will move easily to 104 usd)

