🟢 NEOUSDT 1D : #Buy_RecommendationAs you can see, we have already introduced this Cryptocurrency ( NEO ) at a price of 55$ and offered to buy it, but now it has started a strong movement again and is still valid for reinvestment.
In order to buy, the SL (stop loss) and capital management must be observed.
All resistances and TPs (take profits) are marked on the chart.
👤 Arman Shaban
⚠️(DYOR)
BINANCE:NEOUSDT
NEO

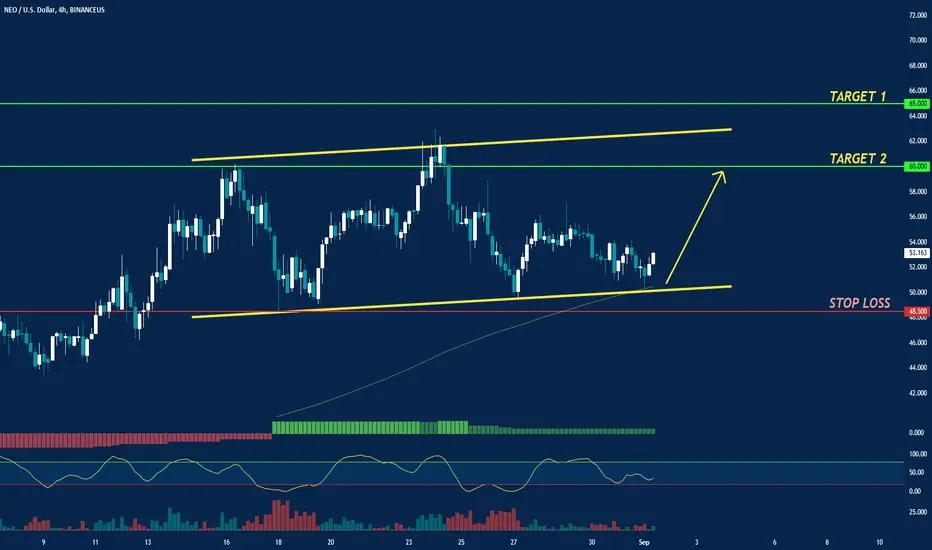
Crypto Neo usdt breakout Long Neo
Targets
1 60
2 65
My entry shown on chart. Mainly looking for 65 dollars to get hit but 60 dollars is a save first profit level to look for, but expect continuation after to 65.
Good luck.


NEO: a breaf explanationR1 is almost broken up and candles closed above this line. so it's a good sign of a better upward momentum.
R2 is a very powerful resistance, btw it's almost far and there's no need to discuss it.
A: Lead span A is downward right now and for better reliability, we prefer to see an upward slope of this line.
B: Lagging span is above the cloud and price chart and it confirms more confident positive signals based on other indicators.
C: conversion line (blue line) needs to change direction upward. to start another upward movement.
Totally: Neo is very good for the long term. if you've bought way before, you should hold until some conservative signals like breaking down the cloud or moving average can confirm the end of the trend. Also, NEO is very potentialite for short-term trades as well. it
for the short term. don't forget that you have to wait for BTC to close above 49100$. so stay conservative until that moment.


NEO/USD: FUNDAMENTALS + NEXT PREDICTION | LONG VIEW 🔔In 2020 NEO was below $10 at the beginning of the year and touched the lowest point of the year of $4 on March 13. After that The NEO value managed to jump to $25.90 by September 20. At the end of the year, the NEO/USD pair settled near $14.
It's well-known that small cryptos copy movements of BTC/USD. Thus, most of the ups and downs of the NEO/USD pair just repeated Bitcoin's trends. For instance, the coronavirus hit financial markets in March 2020 the most, resulting in downtrends in the crypto world, pushing Bitcoin and NEO down.
Still, some events caused divergence in the direction of prices. At the end of July, NEO partnered with the Blockchain-based Services Network. BSN is a global infrastructure that offers a cheap platform for blockchain projects and similar companies, creating a digital economy. This event pushed the NEO rate up. You can see how NEO coin news can affect the price of the cryptocurrency.
The last NEO all-time high price was 196.85 USD on January 15, 2018, it is much higher than in 2020. A strong bullish trend that began after the June 2017 rebranding pushed NEO price to its all-time high. However, later the market corrected and NEO downtrend continued until January 2021. The NEO/USD today’s rate is: $52.46
As the cryptocurrency succeeded in reaching new highs, many traders are attracted to NEO, imagining how much they can earn in the future.
NEO, thanks to its great potential, is a better long-term investment than many other cryptocurrencies. A release of N3 is a springboard for the NEO price.
Wallet Investor believes that, during 2021, the maximum rate of the NEO/USD pair won't be able to touch 130 USD again. After hitting $150 in May, the price will move down, fluctuating within a $62-120 range. Only in December 2021, the price will jump to 129.5 US dollars.
Long Forecast agency predicts an uptrend for NEO from August 2021. The highest rate may reach $184 in October; the lowest price of $110 is still not far from the current rate. Until August, the price will move within the $72-146 range.
NEO to $140 | #NEO #NEOUSDT Hello padawans,
First of all, do not take this as a piece of financial advice.
NEO is one of my favourite projects in cryptoverse.
People called NEO, Chinese Ethereum.
Okay, let's get into the topic.
How did I predict $140 for Polkadot, it is really easy I have drawn extended fib levels for this DOTUSD chart. So I saw,
Extensions
261.8% 75.7751
200% 64.64
161.8% 87.75
100% 55.28
Bottom as ATL
To NEO to reach $140 BTC should stay above $60000 level.
So be careful.
Good luck my dear padawans,
cheers,
May the force be with you.

gas my favtry to accumulate this germ then btc take sudden dump
and thanks me later
2X faster as compare to other coins

#BTCUSD - bearish outlookMid term / swing traders look for retracements. When everyone is mid-term bullish - it's probably a good signal to short, or at least to get out of the asset, especially after last weekly candle exposing weakening bullish sentiment.
The pitch-fork works usually until it doesn't. More crucial in this chart is rather the 200 weekly moving average, which presents statistically best long/asset entry according to value in relation to the last two hundred weeks of price action. If you're here for the money with long term trading outlook, it doesn't really matter how high will asset go, but rather where is the perfect entry from risk management perspective. When price is at top or near ATH (all time high) the financial trading risk is at it's peak. Everyone knows that without saying, nearly everyone ignores it without any logical explanation.
Technical indicators work on historical data... which not always can bring positive trading outcome.
From long term perspective it is irrelevant to disagree with fundamental properties of this asset, broadening understanding of technology explosively affects demand. The bigger the new crowd however, the more unpredictable is panic selling and so is the father of all bubbles - the FEAR OF MISSING OUT.
Be careful, be mindful, be successful by being patient.
Good luck trading,
Adam.

BTCUSD - not always bullish, but bullish foreverMid term / swing traders look for retracements. When everyone is mid-term bullish - it's probably a good signal to short, or at least to get out of the asset, especially after last weekly candle exposing weakening bullish sentiment.
The pitch-fork works usually until it doesn't. More crucial in this chart is rather the 200 weekly moving average, which presents statistically best long/asset entry according to value in relation to the last two hundred weeks of price action. If you're here for the money with long term trading outlook, it doesn't really matter how high will asset go, but rather where is the perfect entry from risk management perspective. When price is at top or near ATH (all time high) the financial trading risk is at it's peak. Everyone knows that without saying, nearly everyone ignores it without any logical explanation.
Technical indicators work on historical data... which not always can bring positive trading outcome.
From long term perspective it is irrelevant to disagree with fundamental properties of this asset, broadening understanding of technology explosively affects demand. The bigger the new crowd however, the more unpredictable is panic selling and so is the father of all bubbles - the FEAR OF MISSING OUT.
Be careful, be mindful, be successful by being patient.
Good luck trading,
Adam.

LINK ATH SPECULATIONIf you're here to call out "so many lines bro", you're clearly a fkn idiot and should stop doing/reading TA.
Orange is Fib based trend, Red is Fib retrace. If you look close, we're still well in the middle of an Elliot Wave (likely a 2 dip) and will probably see lows of even 18ish again.
However, the upside to these dips is some pretty insane gain potentials from 18-36 and 36-66.
It's going to be an exciting few weeks. HODL and accumulate dips.
Nothing is a loss until it's sold.
Never Advice. Love you.
this is the Daily chart

NEOUSDTTwo green boxes are targets. The second one will activate if and only if the price can go above white line.

#BTCUSD - bearish outlookWe've been there before...
I believe 200 weekly MA has a serious role to play, please don't tell me it will never get tested.
I'm here for the money - not for tech.

#BTCUSD - bearish outlookWe've been there before...
I believe 200 weekly MA has a serious role to play and if you're unexperienced enough, please don't tell me it will never get tested.
Time will tell - I give assume we will see if this assumption is correct within next 52 weeks.
I'm out of bitcoin... since 50k.
I'm here for the money - not for tech.


NEO HOLD up to +100In NEO, an upward trend can be seen in the weekly time.
Between 35 and 45 is a good price to buy for Hold.
I have a goal above $ 100 for the next 3 months

NEO possible breakoutHi guys!
If Neo breaks the 60$ zone and consolidates above the resistance zone, it can go up to break the ATH for the next weeks.
This is not a piece of financial advice. Do your own research.
Good Luck.

Cup and handle bullish #neoExactly the there is 1/3 of cup size handle. Need wait for at least 1 month. N3 phase gonna be awesome for neo

NEO: Big Bullish Move In Contemplation !Here is a monthly chart of NEO/USD revealing two BULLISH pattern formation in confluence (Ascending Triangle & Cup and Handle) which can provide high probability trading/investing opportunity.
The last time it was shared (on a Weekly-Timeframe) the price was around $24 and it rocketed from there to $141 and then eventually the big fall was witnessed as BTC pummelled dragging the rest of the market along with it (refer to this chart)
Now, the price seems to get back on track as BTC broke it's consolidation phase and is moving in an uptrend. This analysis is performed on a monthly time-frame and we all know the longer the time-frame, the more reliable the pattern becomes (Although, it may take less than expected time to reach the mentioned levels/targets).
If we look at the chart, we can see the CUP AND HANDLE formation has started surging upwards after spending the time in the congestion area (handle of the pattern) while the ASCENDING TRIANGLE pattern still have time to approach the resistance level and breakout from "Resistance Zone" (which is also the "lip" of the CUP and Handle pattern). Both the patterns will be successful if the price manages to break out of the "Resistance Zone"
However, the failure from there will definitely push the price back to the lower levels. (DYOR)
CryptoCuriousOfficial 📥

NEOUSDNEO breakout Confirmed
If new breakthrough 60$ we will see new targets
hope it breaks Bermuda Triangle

NEOUSDT / day frame Long +10%in my opinion , neo is going to gain 10% in next few hours .
This is not a financial advice .
Do your Own research ..

neo lovelyAll the gold coins exploded, which means that the market is back on the uptrend, so smart money is looking for coins that have not yet exploded.
