NEO on a uptrend channel, about to BREAKNEOBTC, the magical asian coin, lots of projects and plans to build upon, but... will it deliver? Good luck NEO, Good luck!
We have been riding an uptrend channel in the last few days, and it is about to break at about 0.0027 area, it might send NEO down towards the 0.001863 - 0.002015 area
if you are about the long holding, just relax and watch it go up and down for a few more months before we start to go really up!
if you are into collecting more and more, these ups and downs are perfect for filling your bags.
Let me know what do you think.
Good luck
This is just for entertainment purposes and not a financial advice.
Neodollar

NEO TRADE OPPORTUNITY!Hey Fellow traders!
Here is a great short-term trade for you.
We are breaking the triangle again on the chart and may see another rally soon!
Good Luck!


There is a trading opportunity to buy in NEOUSDTechnical analysis:
. NEO/DOLLAR is in a range bound and the beginning of uptrend is expected.
. The price is below the 21-Day WEMA which acts as a dynamic resistance.
. The RSI is at 40.
. While the RSI downtrend and the price downtrend in the daily chart are not broken, bearish wave in price would continue.
Trading suggestion:
. There is a possibility of temporary retracement to suggested support zone (16.259 to 13.665). if so, traders can set orders based on Price Action and expect to reach short-term targets.
Beginning of entry zone (16.259)
Ending of entry zone (13.665)
Entry signal:
Signal to enter the market occurs when the price comes to " Buy zone " then forms one of the reversal patterns, whether " Bullish Engulfing ", " Hammer " or " Valley " in other words,
NO entry signal when the price comes to the zone BUT after any of the reversal patterns is formed in the zone.
To learn more about " Entry signal " and the special version of our " Price Action " strategy FOLLOW our lessons:
Take Profits:
TP1= @ 0.00019800
TP2= @ 0.00021500
TP3= @ 0.00025500
TP4= @ 0.00031580
TP5= @ 0.00049700
TP6= @ 0.00051700
TP7= @ 0.00060700
TP8= @ 0.00073500
TP9= @ 0.00089900
TP10= Free

NEO looks good heading into resistance! After falling off the ledge from $18.30, NEO has bounced nicely off the $15.50 demand zone. After the drop, we consolidated for a few days but Mondays spike up has continued to bring upwards momentum as we try and fill the wick.
EMAs have leveled off and the fast-moving EMA is starting to curl higher and price using it as support as well. We are confined inside the triangle and the supply zone coincides almost perfectly with the trendline & the dynamic trends resistance dots.
As long as we stay above the EMA and volume comes in as we approach and test resistance, we could possibly break through and test the $22 area.
Thanks guys!

NEO could revisit $17NEO continues to look weak after hitting highs of $20 a few ago but that is all forgotten now that we are staring at a possible $17 handle again. It has constantly found resistance at the EMAs and they finally did crossover, which saw a big spike down in price a few days ago following BTCs drop. It did break the demand zone, which has now turned into resistance and most indicators are painting a bearish scene.
MACD continues to drop like a rock while histo is turning upwards slightly while RSI hasn't been able to break above resistance and is looking like it wants to rollover once more. A short scalp can be played here with a decent R:R with a stop placed above the now supply zone and FIB level.
Thanks guys

NEO / NEO/USD | BUY - $18.60 (Target $54.60) - 27 sepBuy - $18.60
Take Profit - $54.60
Stop Loss - $15.60
------------------------------
Target= +$36
Risk= -$3
------------------------------
Risk:Profit = 1:12

NEO - Looks ready for TAKEOFF!!! Neo bounced nicely off the 50%FIB level back on the breakdown from the channel and has since bounce off the demand zone and is trying to make its move back up to the supply zone around the 1.618%FIB at $19.50. There is a resistance spot around $19 before getting up to the supply zone but RSI looks like it could be coming down after getting near resistance.
While MACD histo has turned positive and the signal line just recently crossed over bullish and could spell for more upside in near future. A small pullback here to reset the RSI could help fuel a move higher later on so something to watch here.
Thanks guys!


There is a possibility for the beginning of an uptrend in NEOUSDTechnical analysis:
. NEO/DOLLAR is in a range bound and the beginning of uptrend is expected.
. The price is below the 21-Day WEMA which acts as a dynamic resistance.
. The RSI is at 45.
. The price downtrend in the daily chart is broken, so the probability of the resumption of an uptrend is increased.
Trading suggestion:
. There is a possibility of temporary retracement to suggested support zone (17.223 to 13.665). if so, traders can set orders based on Price Action and expect to reach short-term targets.
Beginning of entry zone (17.223)
Ending of entry zone (13.665)
Entry signal:
Signal to enter the market occurs when the price comes to "Buy zone" then forms one of the reversal patterns, whether "Bullish Engulfing" , "Hammer" or "Valley" in other words,
NO entry signal when the price comes to the zone BUT after any of the reversal patterns is formed in the zone.
To learn more about "Entry signal" and the special version of our "Price Action" strategy FOLLOW our lessons:
Take Profits:
TP1= @ 21.600
TP2= @ 26.771
TP3= @ 34.730
TP4= @ 41.500
TP5= @ 47.850
TP6= @ 57.858
TP7= @ 85.152
TP8= @ 107.212
TP9= @ 140.500
TP10= @ 160.667
TP11= @ 200.60
TP12= Free

There is a possibility for the beginning of an uptrend in NEOUSDTechnical analysis:
. NEO/DOLLAR is in a downtrend and the beginning of uptrend is expected.
. The price is below the 21-Day WEMA which acts as a dynamic resistance.
. The RSI is at 36.
. While the RSI and the price downtrend in the Daily chart are not broken, bearish wave in price would continue .
Trading suggestion:
. There is a possibility of temporary retracement to suggested support zone (15.755 to 9.832). if so, traders can set orders based on Price Action and expect to reach short-term targets.
Beginning of entry zone (15.755)
Ending of entry zone (9.832)
Entry signal:
Signal to enter the market occurs when the price comes to "Buy zone" then forms one of the reversal patterns, whether "Bullish Engulfing" , "Hammer" or "Valley" in other words,
NO entry signal when the price comes to the zone BUT after any of the reversal patterns is formed in the zone.
To learn more about "Entry signal" and the special version of our "Price Action" strategy FOLLOW our lessons:
Take Profits:
TP1= @ 20.825
TP2= @ 26.771
TP3= @ 34.730
TP4= @ 41.500
TP5= @ 47.850
TP6= @ 57.858
TP7= @ 85.152
TP8= @ 107.212
TP9= @ 140.500
TP10= @ 160.667
TP11= @ 200.60
TP12= Free

A trading opportunity to buy in NEOUSDTechnical analysis:
. NEO/DOLLAR is in a range bound and the beginning of uptrend is expected.
. The price is below the 21-Day WEMA which acts as a dynamic resistance.
. The RSI is at 45.
Trading suggestion:
. Price is in the support zone (0.1860 to 0.1380), traders can set orders based on Daily-Trading-Opportunities and expect to reach short-term targets.
Beginning of entry zone (0.1860)
Ending of entry zone (0.1380)
Entry signal:
Signal to enter the market occurs when the price comes to "Buy zone" then forms one of the reversal patterns, whether "Bullish Engulfing" , "Hammer" or "Valley" in other words,
NO entry signal when the price comes to the zone BUT after any of reversal patterns is formed in the zone.
To learn more about "Entry signal" and the special version of our "Price Action" strategy FOLLOW our lessons:
Take Profits:
TP1= @ 43.13
TP2= @ 47.85
TP3= @ 59.04
TP4= @ 67.88
TP5= @ 93.24
TP6= @ 113.74
TP7= @ 140.50
TP8= @ 163.42
TP9= @ 200.60
TP10= Free

There is a trading opportunity to buy in NEOUSD Technical analysis:
. NEO/DOLLAR is in a downtrend but the beginning of uptrend is expected.
. The price is above the 21-Day WEMA which acts as a dynamic support.
. The RSI is at 56.
. The RSI downtrend #1 & The price downtrend in the daily chart are broken, so the probability of resumption of uptrend is increased.
Trading suggestion:
. We have already opened 9 BUY trade(s) @ 36.06691264 based on 'a reversal candle (Valley)' entry method at 2018.07.02 in our suggested support zone (34.73 to 24.65).
Beginning of entry zone (34.73)
Ending of entry zone (24.65)
Entry signal:
Signal to enter the market occurs when the price comes to "Buy zone" then forms one of the reversal patterns, whether "Bullish Engulfing" , "Hammer" or "Valley" in other words,
NO entry signal when the price comes to the zone BUT after any of reversal patterns is formed in the zone.
To learn more about "Entry signal" and the special version of our "Price Action" strategy FOLLOW our lessons:
Take Profits:
TP1= @ 47.85
TP2= @ 59.04
TP3= @ 67.88
TP4= @ 93.24
TP5= @ 113.74
TP6= @ 140.50
TP7= @ 163.42
TP8= @ 200.60
TP9= Free

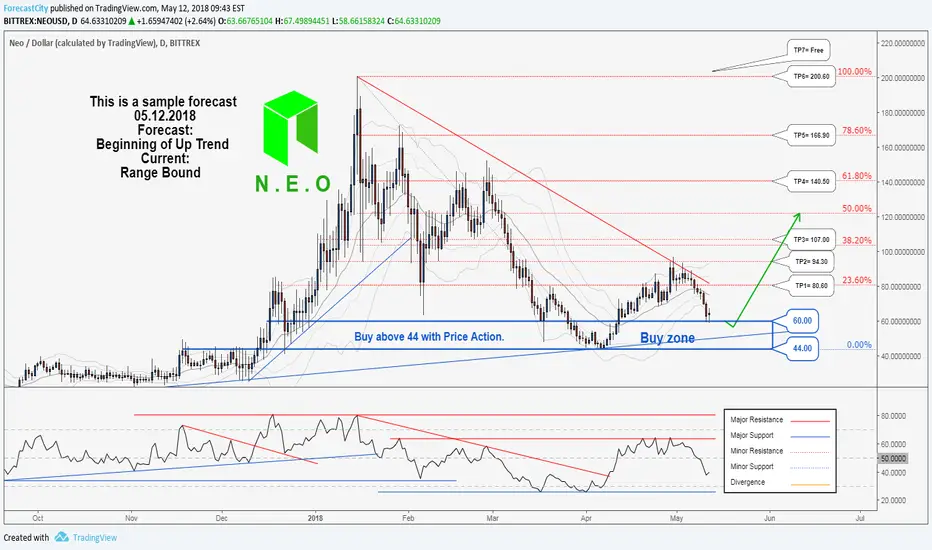
There is a possibility for the beginning of uptrend in NEOUSDTechnical analysis:
.NEO/DOLLAR is in a Range Bound and Beginning of up trend is expected.
.The price is below the 21-Day WEMA which acts as a dynamic resistance.
.The RSI is at 39.
Trading suggestion:
There is a possibility of temporary retracement to suggested support zone (60.00 to 44.00). if so, traders can set orders based on Daily-Trading-Opportunities and expect to reach short-term targets.
.Beginning of entry zone (60.00)
.Ending of entry zone (44.00)
Entry signal:
Signal to enter the market occurs when the price comes to "Buy zone" then forms one of the reversal patterns, whether "Bullish Engulfing" , "Hammer" or "Valley" , in other words,
NO entry signal when the price comes to the zone BUT after any of reversal patterns is formed in the zone.
To learn more about "Entry signal" and special version of our "Price Action" strategy FOLLOW our lessons:
Take Profits:
TP1= @ 80.60
TP2= @ 94.30
TP3= @ 107.00
TP4= @ 140.50
TP5= @ 166.90
TP6= @ 200.60
TP7= Free

NEO , A good opportunity to buy NEOUSD is near!!Technical analysis:
.NEO / DOLLAR is in a range bound But resumption of up trend is expected.
.The price is below the 21-Day WEMA which acts as a dynamic resistance.
.The RSI is at 47.
Trading suggestion:
There is possibility of temporary retracement to suggested support zone (85 to 53), if so, traders can set orders based on Price Action and expect to reach short-term targets.
.Beginning of entry zone (85)
.Ending of entry zone (53)
Entry signal:
Signal to enter the market occurs when the price comes to "Buy zone" then forms one of the reversal patterns, whether "Hammer" or "Trough" , in other words,
NO entry signal when the price comes to the zone BUT after any of reversal patterns is formed in the zone.
To learn more about "Entry signal" and special version of our "Price Action" strategy FOLLOW our lessons:
(We have started to prepare these lessons in TradingView. If you want us to continue, give us feedbacks!)
Take Profits:
TP1= @ 107
TP2= @ 129
TP3= @ 156
TP4= @ 200
TP5= @ Free

NEO/DOLLAR NEOUSD Scalping opportunity aheadNEO /DOLLAR NEOUSD
Excellent scalping opportunity approaching in Neo.
It has never in its history created a green candle that has not
been contested. That doesn't mean that it HAs to be
contested, just that it's 90%.
Hang a sell order out at 37 with a stop just over 40 to avoid
getting hit. it will almost definitely come back to 32.55 at
least and quite likely to 30.37 .
This looks like a breakout/momentum move on thin
air...unless there's a compellling new piece of news today to
accompany this rise, it's almost certain to fall away soon now.
Be very careful if still long from here...risk/reward ratios
gone haywire from here.
