NEO/USDT – Strong Long-Term Accumulation Zone Detected!
🧾 Full Technical Breakdown (1W Timeframe):
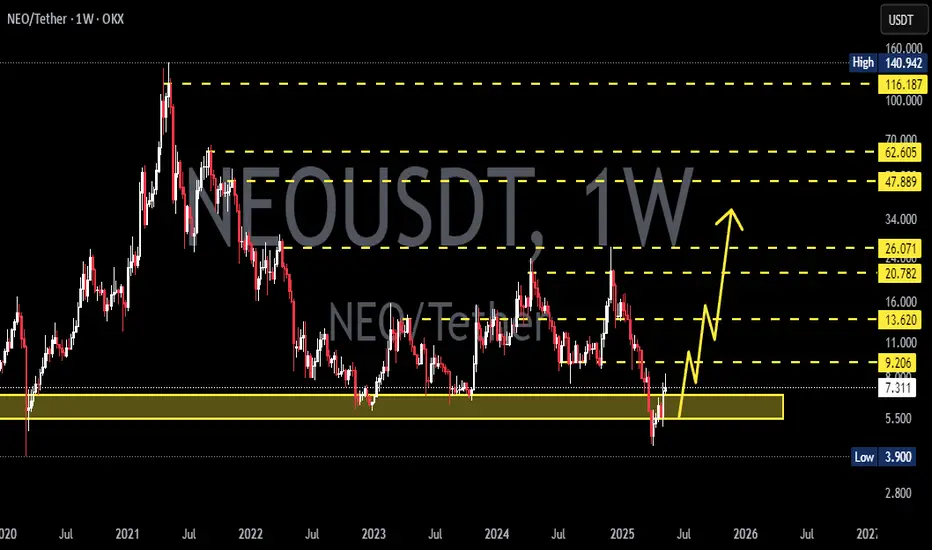
NEO is currently revisiting a multi-year demand zone in the range of $3.90 – $4.50, a historically critical level where price has previously bounced before initiating massive rallies.
This zone has acted as a strong accumulation base during:
March 2020 crash
Mid-2019 correction
And now again in 2025 — making this the third test of the zone in a macro cycle.
The recent candlestick behavior shows price compression with long wicks, signaling demand absorption and the potential emergence of buyers.
📐 Key Pattern Formation:
Possible Double Bottom or Adam & Eve Reversal Pattern forming on the weekly chart.
Combined with horizontal support and psychological round number zone ($4–$5), this can be the foundation of a long-term trend reversal.
Price has entered a volatility contraction phase, which often precedes an impulsive breakout.
📈 Bullish Scenario:
If the support holds and we see a breakout with increasing volume:
1. Short-Term Targets:
$6.85 (local resistance)
$9.10 (previous consolidation block)
2. Mid-Term Targets:
$14.31 (last major breakdown level)
$21.54 (multi-month range resistance)
3. Long-Term Targets:
$29.38 – psychological level from previous cycle
$47.88 – historical supply zone
$62.48+ – potentially a multi-year bullish cycle if macro market turns risk-on
Watch for:
Bullish engulfing or hammer candle on the weekly
Breakout from descending structure with strong RSI divergence
Volume expansion above key resistances
📉 Bearish Scenario:
If the yellow support box fails:
Breakdown below $3.90 may signal continuation of macro downtrend.
Immediate bearish targets: $3.30 (2019 low), followed by price discovery below.
Invalidates the bullish reversal structure.
Could coincide with overall crypto market capitulation.
Risk Mitigation:
Use tight stop-loss below $3.90 if entering early
Scale into positions gradually (DCA) instead of full entries
🔥 Strategic Summary:
> “High-conviction zones are not found often — but this looks like one of them.”
With confluence of:
Historical demand zone
Psychological support
Pattern structure
Volume tapering near bottom
…this could be one of the last best accumulation zones for NEO if the market recovers over the next 6–12 months. A macro trend reversal could offer 4x–10x returns if history plays out once again.
📊 Resistance Levels to Watch:
$6.85
$9.10
$14.31
$21.54
$29.38
$47.88
$62.48
$115.28 (macro ATH level)
#NEOUSDT #NEOTechnicalAnalysis #CryptoReversal #BullishCrypto #NEOAccumulation #AltcoinBreakout #NEOPricePrediction #WeeklyCryptoAnalysis #SupportAndResistance #NEOChart #DoubleBottomPattern
Neousdtlong

#NEO is back at its historical demand zone!#NEO
The price is moving within a descending channel on the 1-hour frame, adhering well to it, and is on its way to breaking it strongly upwards and retesting it.
We have a bounce from the lower boundary of the descending channel, this support at 5.45.
We have a downtrend on the RSI indicator that is about to be broken and retested, supporting the upside.
There is a major support area in green at 5.30, which represents a strong basis for the upside.
Don't forget a simple thing: ease and capital.
When you reach the first target, save some money and then change your stop-loss order to an entry order.
For inquiries, please leave a comment.
We have a trend to hold above the 100 Moving Average.
Entry price: 5.55
First target: 5.63
Second target: 5.73
Third target: 5.86
Don't forget a simple thing: ease and capital.
When you reach your first target, save some money and then change your stop-loss order to an entry order.
For inquiries, please leave a comment.
Thank you.

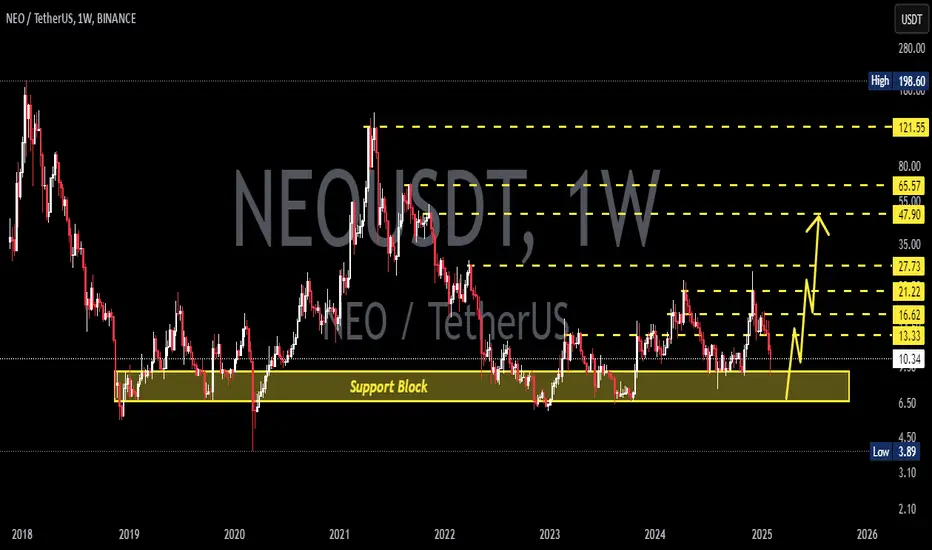
NEOUSDT 1W AnalysisNEO ~ 1W Analysis
#NEO This is the lowest support block for now. Buy gradually from here with a short term target of at least 20%+

NEOUSDT 1W AnalysisNEO ~ 1W Analysis
#NEO Buy gradually from here if you still have confidence in this coin with a short term target of at least 20%+.
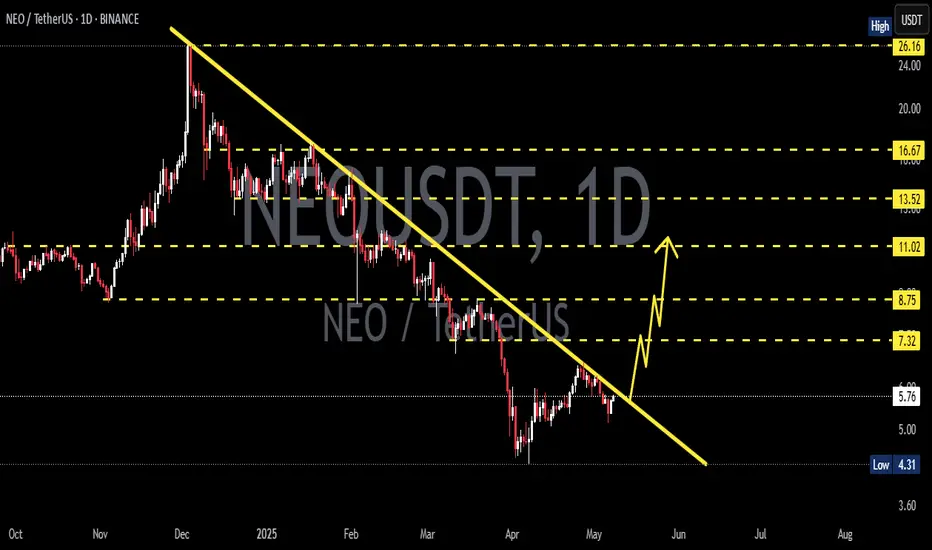
NEOUSDT 1D AnalysisNEO ~ 1D Analysis
#NEO Buy after successfully breaking this resistance line with a short term target of at least 10%+ from here.
NEOUSDT 1WNEO ~ 1W Analysis
#NEO Buy gradually from here with a short -term target of at least 20%+. This is the lowest support for now.

NEOUSDT 1WNEO ~ 1W Analysis
#NEO Buy from here if you still have a Conviction on this coin with a minimum target of 20%+
NEOUSDT Long Setup Setting / Spot TradeBINANCE:NEOUSDT
CRYPTO:NEOUSD
📈Which side you pick?
Bull or Bear
SL1 ---> Low-risk status: 3x-4x Leverage
SL2 ---> Mid-risk status: 5x-8x Leverage
(If there is just one SL on the chart, I suggest, low risk status)
👾Note: The setup is active but expect the uncertain phase as well. also movement lines drawn to predict future price reactions are relative and approximate.
➡️Entry Area:
Yellow zone
⚡️TP:
18
20
23.5
25 (Optimistic)
🔴SL:
12.88
🧐The Alternate scenario:
If the price stabilizes against the direction of the position, below or above the trigger zone, the setup will be canceled.

NEOUSDT 1WNEO ~ 1W
#NEO If you still have Conviction on this coin,. Buy gradually after breaking through the resistance line of this pattern. with a minimum target of 20%+

NEOUSDTNEO ~ 1W
#NEO If you still have Conviction on this coin,. This support block will be a very good buying place so far,. with a minimum target of 20%++

NEO (NEOUSD) Long Trade TargetsNEO (NEOUSD) Long Trade Targets
On the 1 hour time frame, we got a clear LONG trade setup up.
Entry: $9.45
Stoploss: $9.19
Targets: TP1 and TP2 done
Exiting partially here and waiting for the TP3 and TP4
Follow for more insight, trade setups and charts.
Best regards.

Neo long setup / Bulls or Bears, Tell me in CommentsBINANCE:NEOUSDT By CrazyS
COINBASE:NEONUSD
Hello Traders
💥Long position on NEO
SL1 ---> Low-risk status: 3x-4x Leverage
SL2 ---> Mid-risk status: 5x-8x Leverage
👾The setup is active but expect the uncertain phase as well.
➡️Entry Area:
Yellow zone
⚡️TP:
9.60
9.72
9.83
9.95
10.10
🔴SL:
9.03 - 8.93
🧐The Alternate scenario:
If the price stabilizes below the trigger zone, the setup will be cancelled.

NEOUSDT 1W-TIMEFRAME ANALYSIS💥NEOUSDT 1W-TIMEFRAME ANALYSIS
💗Hello ladies and gentlemen
This is my new idea for 💥NEOUSDT Neo
I hope my idea is clear
Support me by like and share thank you
Stay Safe💯💲💲💲
Good luck💰😍

You're LUCKY to see this, NEOUSDT analysis!Hello, guys.
This is ESS team.
Let's see the NEOUSDT chart.
If candle is supported by the bottom PURPLE uptrend line, it is expected to break through the RED long-term downtrend line.
After the break through, It will reach the top green uptrend line.
After that, If it breaks through the top green uptrend line and is supported by green, It will reach the top orange upward trend line.
If it isn't supported by the lower purple uptrend line, It will
try again after accumulation with near the lower pink uptrend line.

NEO/USDT LONGIn the logarithmic chart of the Neo currency, a BAT harmonic pattern is formed and the price is expected to grow up to the specified range

NEO Long IdeaNeo Buy zone is $15 , $17 for me and I think I will buy from there if it falls. I think these two scenarios will develop, stay tuned. fibonacci levels are very important.

#NEOUSDT $NEOUSDT #NEO Long BiasIf price stays above the Green Box then you can take profit on these levels. Good Luck.

Two ways of NEOI believe there is two ways that could go NEO. Either it will follow M structure to fall back down, or it will grow until 20-25.
This is my trial. Not a financial advice.

Is NEO repeating the pattern of the past bear market? Hello everyone!
If you're looking for a hefty profit and are willing to wait, then take a look at NEO.
On the weekly timeframe, you can see that the price movement is very similar to the price movement in the previous bear market. Back then, there was also a long sideways period that lasted 847 days before the price surged upwards.
Currently, there is a similar sideways period with the upper boundary being the 0.236 Fibonacci level, and the asset is at the bottom of this sideways range.
The price could still drop to $5.9 per coin. So, the timing of when to open a position remains open.
Fibonacci levels serve as targets on the chart.
This is not financial advice, and anything you do is at your own risk.

NEOUSDI am expecting NEOUSD to break the previous mini high in order for it to continue it moves upward to the previous higher high of the main upward trend which is my take profit point.

NEO coin forming bullish Cypher for upto 19% pumpHi dear friends, hope you are well and welcome to the new trade setup of NEO coin with US Dollar pair.
Previously we caught almost 90% pump of NEO as below:
Now on a 2-hr time frame NEO is forming a bullish Cypher for the next price reversal.
Note: Above idea is for educational purpose only. It is advised to diversify and strictly follow the stop loss, and don't get stuck with trade.

Neo bullishNeo is bullish because its bullish breakout retest and also golden fibbonacci ratio numbers on 4h time frame

NEO 15 MINIT TF LONGHELL0 FRIENDS
Today i entry in NEO usdt my chart analysis elloit and smc conspect
elliot C wave currently moving down
entry : 10.5 to 10.488
sl : 10.38
target : 10. 95
leverage : 3x to 5x
thanks
if you have any suggestion please leave your comments
