NEO/USDT – Strong Long-Term Accumulation Zone Detected!
🧾 Full Technical Breakdown (1W Timeframe):
NEO is currently revisiting a multi-year demand zone in the range of $3.90 – $4.50, a historically critical level where price has previously bounced before initiating massive rallies.
This zone has acted as a strong accumulation base during:
March 2020 crash
Mid-2019 correction
And now again in 2025 — making this the third test of the zone in a macro cycle.
The recent candlestick behavior shows price compression with long wicks, signaling demand absorption and the potential emergence of buyers.
📐 Key Pattern Formation:
Possible Double Bottom or Adam & Eve Reversal Pattern forming on the weekly chart.
Combined with horizontal support and psychological round number zone ($4–$5), this can be the foundation of a long-term trend reversal.
Price has entered a volatility contraction phase, which often precedes an impulsive breakout.
📈 Bullish Scenario:
If the support holds and we see a breakout with increasing volume:
1. Short-Term Targets:
$6.85 (local resistance)
$9.10 (previous consolidation block)
2. Mid-Term Targets:
$14.31 (last major breakdown level)
$21.54 (multi-month range resistance)
3. Long-Term Targets:
$29.38 – psychological level from previous cycle
$47.88 – historical supply zone
$62.48+ – potentially a multi-year bullish cycle if macro market turns risk-on
Watch for:
Bullish engulfing or hammer candle on the weekly
Breakout from descending structure with strong RSI divergence
Volume expansion above key resistances
📉 Bearish Scenario:
If the yellow support box fails:
Breakdown below $3.90 may signal continuation of macro downtrend.
Immediate bearish targets: $3.30 (2019 low), followed by price discovery below.
Invalidates the bullish reversal structure.
Could coincide with overall crypto market capitulation.
Risk Mitigation:
Use tight stop-loss below $3.90 if entering early
Scale into positions gradually (DCA) instead of full entries
🔥 Strategic Summary:
> “High-conviction zones are not found often — but this looks like one of them.”
With confluence of:
Historical demand zone
Psychological support
Pattern structure
Volume tapering near bottom
…this could be one of the last best accumulation zones for NEO if the market recovers over the next 6–12 months. A macro trend reversal could offer 4x–10x returns if history plays out once again.
📊 Resistance Levels to Watch:
$6.85
$9.10
$14.31
$21.54
$29.38
$47.88
$62.48
$115.28 (macro ATH level)
#NEOUSDT #NEOTechnicalAnalysis #CryptoReversal #BullishCrypto #NEOAccumulation #AltcoinBreakout #NEOPricePrediction #WeeklyCryptoAnalysis #SupportAndResistance #NEOChart #DoubleBottomPattern
Neousdtrends

NEOUSDT 1D AnalysisNEO ~ 1D Analysis
#NEO Buy after successfully breaking this resistance line with a short term target of at least 10%+ from here.
NEOUSDT 1WNEO ~ 1W
#NEO If you still have Conviction on this coin,. Buy gradually after breaking through the resistance line of this pattern. with a minimum target of 20%+

NEOUSDTNEO ~ 1W
#NEO If you still have Conviction on this coin,. This support block will be a very good buying place so far,. with a minimum target of 20%++

NEO Long IdeaNeo Buy zone is $15 , $17 for me and I think I will buy from there if it falls. I think these two scenarios will develop, stay tuned. fibonacci levels are very important.


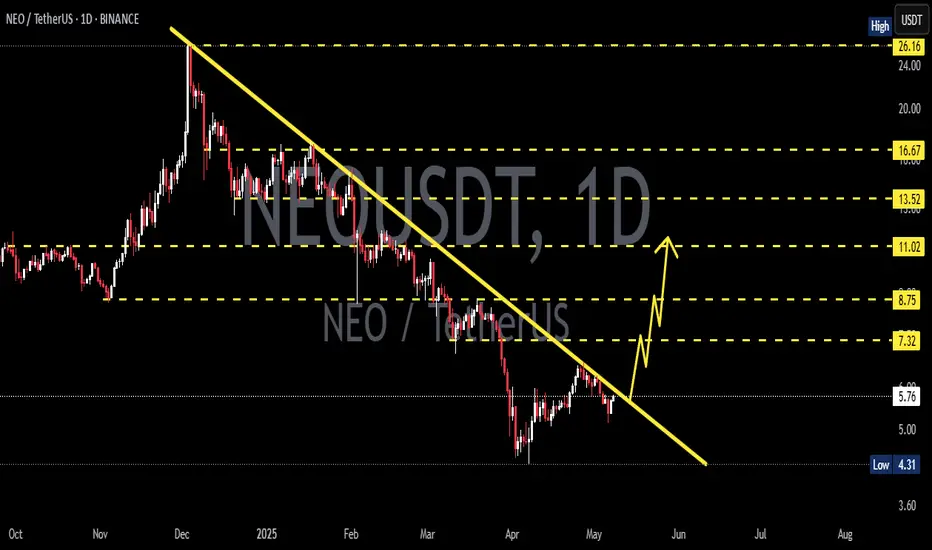
NEOUSDT : 1D TF Let's go for long :))As we can see, after breaking its downward trend, the price is gathering strength to start a strong climb.
In order to buy, the SL (stop loss) and capital management must be observed.
All resistances and TPs (take profits) are marked on the chart.
(DYOR)

NEOUSDT 1W-TIMEFRAME ANALYSIS✨NEOUSDT 1W-TIMEFRAME ANALYSIS✨
Hello ladies and gentlemen
This is my new idea for NEOUSDT
I expect the price to move higher...
I hope my idea is clear
Support me by like and share
Stay Safe💯
Good luck💰

NEOUSDT - level built on two maximumsFalse break out and there is no downward movement.
Level 16.6 is surrounded by a zone of interest.
Level built on two maximums.
Breakdown of the slope locally tested on 1H timeframe
Global trend bullish
Dear followers, the best "Thank you" will be your likes and comments!
These ideas are not a channel with signals and I do not give recommendations on the entry/exit points.
In my reviews, I provide analytics - those data that help model potential options/scenarios for price movements
Thanks for your support!

NEO / U.S. DOLLAR (NEOUSD) Weekly & DailyDates in the future with the greatest probability for a price high or price low.
The Djinn Predictive Indicators are simple mathematical equations. Once an equation is given to Siri the algorithm provides the future price swing date. Djinn Indicators work on all charts, for any asset category and in all time frames. Occasionally a Djinn Predictive Indicator will miss its prediction date by one candlestick. If multiple Djinn prediction dates are missed and are plowed through by same color Henikin Ashi candles the asset is being "reset". The "reset" is complete when Henikin Ashi candles are back in sync with Djinn price high or low prediction dates.
One way the Djinn Indicator is used to enter and exit trades:
For best results trade in the direction of the trend.
The Linear Regression channel is used to determine trend direction. The Linear Regression is set at 2 -2 30.
When a green Henikin Ashi candle intersects with the linear regression upper deviation line (green line) and both indicators intersect with a Djinn prediction date a sell is triggered.
When a red Henikin Ashi candle intersects with the linear regression lower deviation line (red line) and both indicators intersect with a Djinn prediction date a buy is triggered.
This trading strategy works on daily, weekly and Monthly Djinn Predictive charts.
This is not trading advice. Trade at your own risk.


NEO Technical Analysis - NEOUSD - 443% Profit ExpectedNEO Technical Analysis - NEOUSD - 63%-443% Profit Expected
BIG Trade Coming For NEO...4x - 5x Gains Expected.
Based on AB=CD pattern , Time Ratio & Gann Analysis, It's a potential long position with great returns :)
In a lower time-frame (4hrs) this long position has also been confirmed.
For Bigger Time-Frame
Target Profit Range - 13 - 32
(63%-443% Profit Expected)
TP - 1 - 13
TP - 2 - 17
TP - 3 - 20
TP - 4 - 24
TP - 5 - 28
TP - 6 - 32
Buying Zone! Long Position
Early Entry Trigger Point - 6 - 8
Ideal Entry Trigger Point - 4 - 6
***If you want to get in this trade from this point $11 you can still make 18% profit till TP1 is reached. There is a very high probability that price may continue to move upwards before it moves downwards towards my ideal entry point., It is recommended to enter with a smaller lot size if you want to go long right away & manage your stop loss accordingly.
Short-term Trade- 1hr- chart
I see a possible move going upwards and may hit $13 or it can even touch $17 mark that's why I have mentioned the points in a chart for a short-term long position too. As it's a short term risky trade, it is highly recommended to enter with a smaller lot size if you want to go long right away & manage your stop loss accordingly.
Good Luck.!
Disclaimer - This is not financial advice. This is my personal view and analysis of this chart.
If you follow this idea please plan your trade according to your lot size and account equity.
Don't forget to like, comment & follow, If you agree with my analysis :)
