Possibility of uptrend Wave c is expected to end at the green support zone and start an uptrend. A break of the support zone will invalidate the above scenario.
Neo Wave

Possibility of uptrend It is expected that a corrective and fluctuating trend will form until the specified time frame. Then there is a possibility of a trend change and the start of an upward trend.
With the breakdown of the support level, the above scenario will be invalidated.

Possibility of correction A trend change is expected to occur within the resistance levels and a continuation of the downtrend is expected. If the price breaks through the resistance level, a continuation of the uptrend is possible.

possibility of correctionGiven the behavior of the index in the resistance range and the resistance trend line, an upward trend is expected. Otherwise, a downward trend to the previous low is possible.

check the trendIf the price breaks through the support area, the downward trend will likely continue. Otherwise, if the green resistance area is broken, the upward trend will likely continue.

possibility of correctionIt is expected that a trend change will form in the current resistance area and we will see the beginning of the downward trend. If the price breaks through the resistance area, the upward trend will likely continue.

check the trendConsidering the price behavior in the green support area, possible scenarios have been identified. The price is expected to break through the support area and continue the downward trend.

possibility of uptrendIt is expected that the corrective trend will eventually end in the specified support area and we will see the beginning of the upward trend. If the support area is broken, the continuation of the downward trend is likely.

correctionGiven the price behavior in the current support area, a corrective trend is expected. As long as the price does not consolidate above the previous ceiling, a corrective trend is likely.

check the trendIt is expected that the trend will change in the current support area and we will see the beginning of the upward trend. The break of the resistance trend line will be a confirmation of the upward trend.

possibility of uptrendAs long as the index fluctuates above the green support range, the continuation of the upward trend will be likely. Otherwise, the continuation of the correction will be likely.

check the trendConsidering the price behavior within the current support range, possible scenarios have been identified. It is expected that the correction will continue and advance to the specified support range.

possibility of uptrendIt is expected that a trend change will form within the current support range and we will witness the start of an upward trend. If the price crosses the green support range, the continuation of the downward trend will be likely.

ETH(based on NEowave)I changed my analysis and I think Its better to consider eth in the middle of the running diamond diametrical.
stop loss of this analysis is 2400$.

GUN Analysis (4H)By analyzing he GUN chart, a large wave B can be identified, which started from the point marked with a green arrow.
This wave appears to be a diametric, and we are currently at the end of wave F of this diametric. It is expected that wave F will complete at the green zone and wave G of the diametric will begin from there. Wave G is bullish.
The targets are marked on the chart.
A daily candle closing below the invalidation level will invalidate this analysis.
For risk management, please don't forget stop loss and capital management
When we reach the first target, save some profit and then change the stop to entry
Comment if you have any questions
Thank You

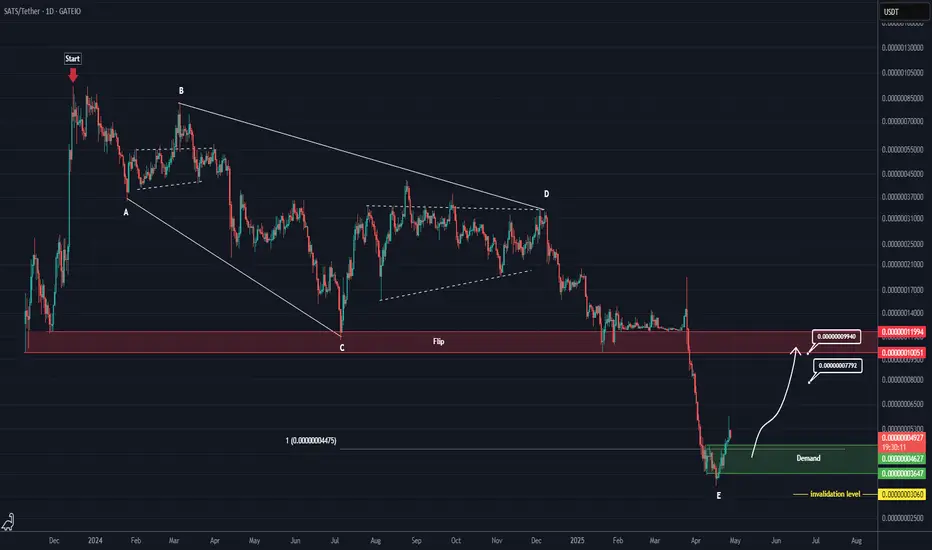
SATS has completed a corrective pattern (1D)Attention: This is a risky and highly volatile meme coin.
The correction of SATS started from the point where we placed the red arrow on the chart.
This correction appears to be an expanding triangle, as wave C is longer than wave A, and wave E is longer than wave C.
Currently, a support zone has formed below the price. As long as this area holds, the price can move toward the flip zone or near it.
Since the flip zone is fresh and untouched, the price may get rejected from this level.
The closure of a daily candle below the invalidation level would invalidate this analysis.
For risk management, please don't forget stop loss and capital management
When we reach the first target, save some profit and then change the stop to entry
Comment if you have any questions
Thank You
Change the trend It is expected that a trend change will take place within the current support range and we will witness the start of an uptrend. Otherwise, the downtrend will continue along the specified path.

Check the trend The uptrend is expected to continue to the next resistance level. Then, depending on the price behavior within this range, there is a possibility of a correction.

Check the trend It is expected that after some fluctuation and correction in the resistance area, the downtrend will continue. If the price breaks through the resistance area, it can rise to the resistance trend line.

Uptrend The price is expected to consolidate above the support level and then continue the uptrend. If the price breaks through the support level, a continuation of the downtrend is likely.

Possibility of uptrend The price is expected to move in the specified direction and after the completion of the corrective pattern, the start of an uptrend is likely. A break of the support zone will cause the continuation of the downtrend.

Check the trend Given the price behavior within the current resistance range, possible scenarios have been identified. It is expected that the uptrend will continue and advance to certain Fibonacci levels.

Possibility of uptrend A trend reversal is expected at the current support level. Then, a break of the green resistance level will confirm the uptrend. Otherwise, a break of the support level will likely lead to a continuation of the downtrend.
