Check the trend The price is expected to consolidate above the current support range and then we will see the start of an upward trend.
Neo Wave

Uptrend The price is expected to break through the resistance trend line and establish a continuation of the uptrend. If the price breaks through the support area, the above scenario will be invalidated and a continuation of the downtrend will be likely.

Check the trend It is expected that a trend change will take place at the current support level and we will see the start of an uptrend. Otherwise, a break of the support level will lead to a continuation of the downtrend to the specified support levels.

Check the trend A trend change is expected to form at the green support zone and we will see the start of an uptrend. Otherwise, a continuation of the downtrend to the next support zone is possible.

Upward trend It is expected that the uptrend will continue and the index will break through the resistance level. With the consolidation above the resistance level, the uptrend will continue.

Possibility of uptrend It is expected that after consolidation above the green support zone, the upward trend will continue. If the support zone is broken, the continuation of the correction will be likely.

Possibility of uptrend It is expected that the price will consolidate above the support level, then the upward trend will likely continue. Otherwise, if the support level is broken, the downward trend will continue to the next support levels.

BTC New Update (12H)The upward wave appears to be a complex correction. Price may retrace downward either from this area or from the red box, and then we could see another strong bullish move from Bitcoin starting from the green zone.
It doesn’t matter where the rejection occurs | what matters is the green Rebuy zone marked on the chart.
In the green zone, we are looking for buy/long positions.
A daily candle closing below the invalidation level will invalidate this analysis.
For risk management, please don't forget stop loss and capital management
When we reach the first target, save some profit and then change the stop to entry
Comment if you have any questions
Thank You

BTC Dominance New Update (12H)This analysis is an update of the analysis you see in the "Related publications" section
We had a bullish diametric for Bitcoin, and it seems that the price has reached the highest point of this diametric. Wave E of this diametric, which is a bullish wave, is nearing its end.
We refer to this as the highest point because Wave G might not reach the peak of Wave E.
We expect a rejection from the red box, and this rejection could be very strong. Smaller altcoins could experience a significant pump.
A daily candle closing above the invalidation level would invalidate this analysis.
For risk management, please don't forget stop loss and capital management
Comment if you have any questions
Thank You

ETHFI Looks Super Bullish (1D)It seems that wave C of our higher-degree correction has completed. Wave C appears to be a diametric pattern.
As long as the green zone holds, the price could advance toward the red Flip zone, where wave D may form.
A daily candle closing below the invalidation level would invalidate this view.
For risk management, please don't forget stop loss and capital management
When we reach the first target, save some profit and then change the stop to entry
Comment if you have any questions
Thank You

Over 140% profit with IMX (3D)IMX appears to be in a large wave B, which is forming a triangle. It is currently at the end of wave d of B.
It is expected that upon touching the green zone, wave e of B will begin, pushing the price into a bullish phase.
We are looking for buy/long positions in the green zone.
A weekly candle closing below the invalidation level will invalidate this analysis.
For risk management, please don't forget stop loss and capital management
When we reach the first target, save some profit and then change the stop to entry
Comment if you have any questions
Thank You

ETH(based on NEowave)Im sharing this because wave D is at the end and in the next 2 month you can see the main movement which is the start of wave E.
wave E takes about 350-450 days but after that there is a big and longtime bearish wave!

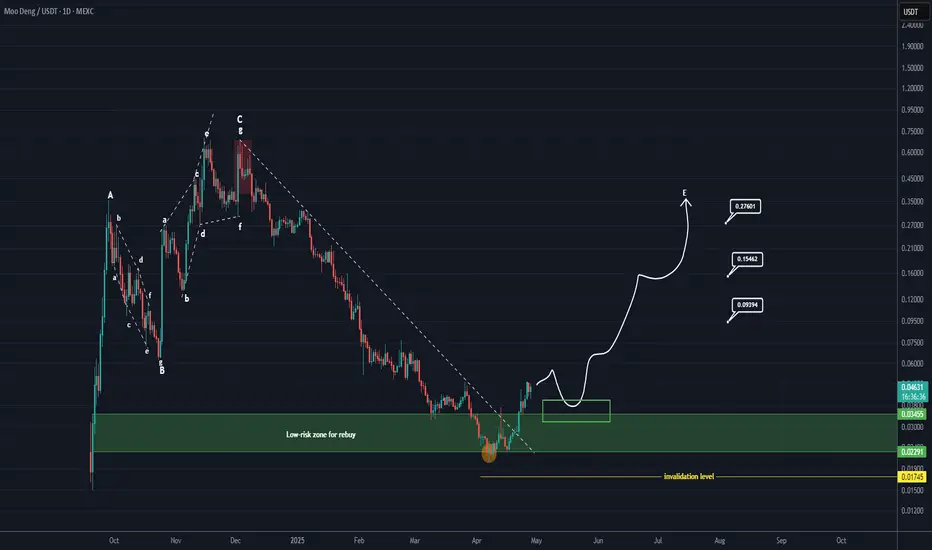
MOODENG Looks Super Bullish (1D)After a series of significant drops, MOODENG has reached a golden zone and has accumulated buy orders, which suggests that it may have established a price floor.
Given the break of the medium-term descending trend line and the strong buy orders being fed from a solid source, we expect MOODENG to start an upward trend that could last for 2 to 3 months.
The upper green box is the Rebuy area.
A weekly candle closing below the upper green box (which is our Rebuy area) will invalidate this analysis.
For risk management, please don't forget stop loss and capital management
When we reach the first target, save some profit and then change the stop to entry
Comment if you have any questions
Thank You
BTC NEW UPDATE (4H)This analysis is an update of the analysis you see in the "Related publications" section
Bitcoin has not yet reached our zone, but it has formed a correction of the same degree as the previous ones and has also created a support area. The diametric pattern could potentially shift into a symmetrical one, and Bitcoin may even reach the 100K–105K zone.
We should keep a close eye on the 100K level for now, as it also serves as a psychological resistance.
For risk management, please don't forget stop loss and capital management
Comment if you have any questions
Thank You

GMT New Update (The bullish wave is continuing) 12HThis analysis is an update of the analysis you see in the "Related publications" section
The previous setup is canceled due to the risk of being left behind.
The wave structure has been reanalyzed. It appears that GMT is in a large corrective pattern, likely a diametric, and wave F has completed. Wave F was a symmetrical structure that has now ended.
As long as the POI zone holds, the price can move toward the targets. The targets are marked on the chart. This movement is considered wave G of a higher degree.
A daily candle closing below the invalidation level will invalidate this view.
For risk management, please don't forget stop loss and capital management
When we reach the first target, save some profit and then change the stop to entry
Comment if you have any questions
Thank You

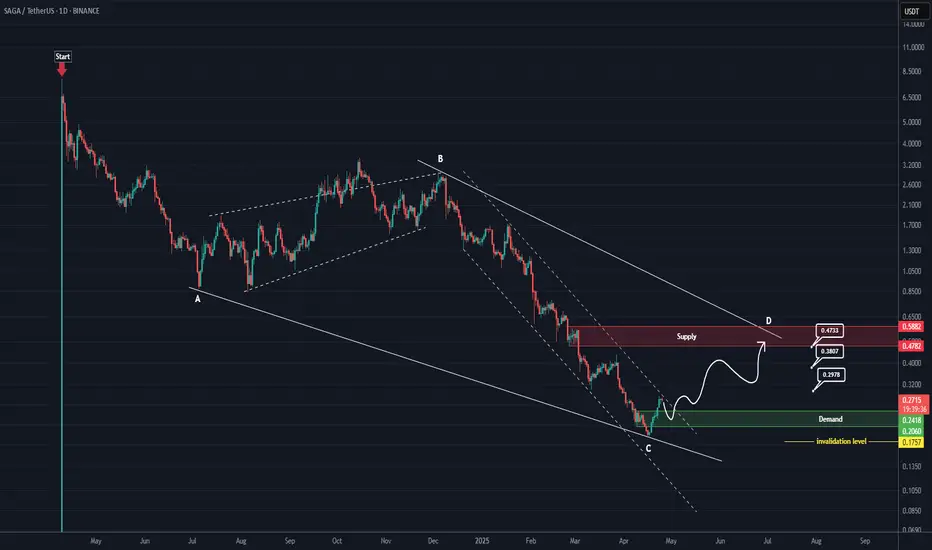
SAGA RoadMap (1D)From the point where we placed the red arrow on the chart, it appears that SAGA's correction has begun.
This correction seems to be either a diametric or a symmetrical pattern. Now, considering the extended duration of wave C, its relative comparison with the other waves, the heavy drop, and the formation of a demand zone at the bottom, wave C seems to have ended.
A rebuy can be considered on the pullback to the green zone.
The targets are marked on the chart.
A daily candle closing below the invalidation level will invalidate this analysis.
For risk management, please don't forget stop loss and capital management
Comment if you have any questions
Thank You
SYS looks very bullish (1D)It seems that a diametric pattern has completed, and the price has reclaimed a key level. A pullback to this level is expected to hold as support, potentially leading the price toward higher zones.
The targets are marked on the chart, and as long as the green zone is maintained, a move toward those targets is expected.
A daily candle closing below the invalidation level would invalidate this analysis.
For risk management, please don't forget stop loss and capital management
When we reach the first target, save some profit and then change the stop to entry
Comment if you have any questions
Thank You

check the trendIt is expected that after some fluctuations and corrections, the upward trend will continue.
If the index crosses the support trend line, the continuation of the correction trend to the specified support range will be possible.

possibility of uptrendIt is expected that a trend change will form within the current support level and we will witness the beginning of the upward trend.
Otherwise, with the support level broken, the continuation of the downward trend will be likely.

possibility of uptrendIt is expected that the corrective trend will form until the specified support levels, and then the continuation of the upward trend will be possible.
If the price breaks the support levels and the support trend line, the continuation of the downward trend will be likely.

check the trendIt is expected that the upward trend will form until the specified resistance level, and then the continuation of the downward trend will be likely. Otherwise, the continuation of the upward trend will be possible until the specified Fibonacci levels.

correctionThe correction trend is expected to progress to the specified support levels, then there is a possibility of a trend change and the start of an upward trend.

check the trendGiven the breakdown of the support level and trend line, it is expected that after the specified corrections to the resistance levels, a continuation of the downward trend will form.
