Neutral Triangle completion | Breakout AbvThe Neutral Triangle pattern.
- Either e-wave is still in making if down move continues.
- But Breakout upside looks imminent.. completing the neutral triangle pattern.
The upside breakout should retrace e-wave in lessor time.
Neo Wave
Possibility of uptrend A trend change is expected to form within the current support area and we will see the start of an uptrend. A break of the resistance trend line will be confirmation of the uptrend.

Check the trend It is expected that within the current support area and the specified time frame, the corrective pattern will be completed and we will witness the start of an upward trend. If the price breaks through the red support area, a continuation of the downward trend will be possible.

Possibility of uptrend The price is expected to consolidate above the support area, then if the resistance trend line is broken, a continuation of the uptrend is likely.

Possibility of correction The price is expected to consolidate above the current support level. Then, a continuation of the uptrend is likely. Otherwise, a continuation of the downtrend to the specified support levels is possible.

Check the trend It is expected that after some fluctuation and correction, the upward trend will continue to form until the specified resistance level. Then, the continuation of the movement will proceed according to the specified paths.

Uptrend If a trend change occurs within the current support range, an uptrend is likely to begin. Otherwise, the correction will continue.

Uptrend If the price breaks through the red resistance zone and the resistance trend line, the continuation of the uptrend is likely. Otherwise, the continuation of the downtrend is likely.

Possibility of uptrend Given the behavior of the index within the current resistance range, possible scenarios have been identified. It is expected that after some volatility, a corrective trend will form.

Possibility of uptrend As long as the price fluctuates above the support zone and the support trend line, the uptrend is likely to continue. Otherwise, a correction is possible.

Check the trend It is expected that within the current support range and the specified time frame, a trend change will take place and we will witness the beginning of an upward trend.

TUT Analysis (2H)From the point marked as "start" on the chart, the TUT correction has begun.
It appears to be an ABC correction, and we are currently in wave B of this ABC.
Wave B seems to be a complex correction, possibly a triangle or a diametric, and we are currently in wave c of B.
Wave c of B itself appears to be forming a symmetrical pattern.
It is expected to move toward the red box while maintaining the green zone.
The targets are indicated on the chart.
A daily candle closing below the invalidation level would invalidate this analysis.
For risk management, please don't forget stop loss and capital management
Comment if you have any questions
Thank You

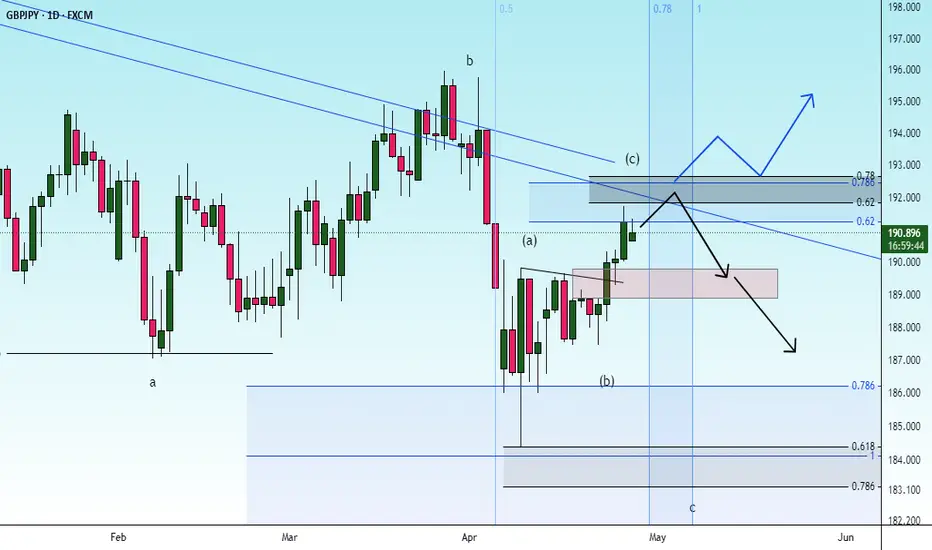
HYPER Analysis (4H)From where we placed the red arrow on the chart, the HYPER correction has started.
This corrective pattern might be diametric, with wave E near completion.
By maintaining the green box, it could move toward the targets, which are marked on the chart.
A daily candle closing below the invalidation level will invalidate this analysis.
For risk management, please don't forget stop loss and capital management
When we reach the first target, save some profit and then change the stop to entry
Comment if you have any questions
Thank You

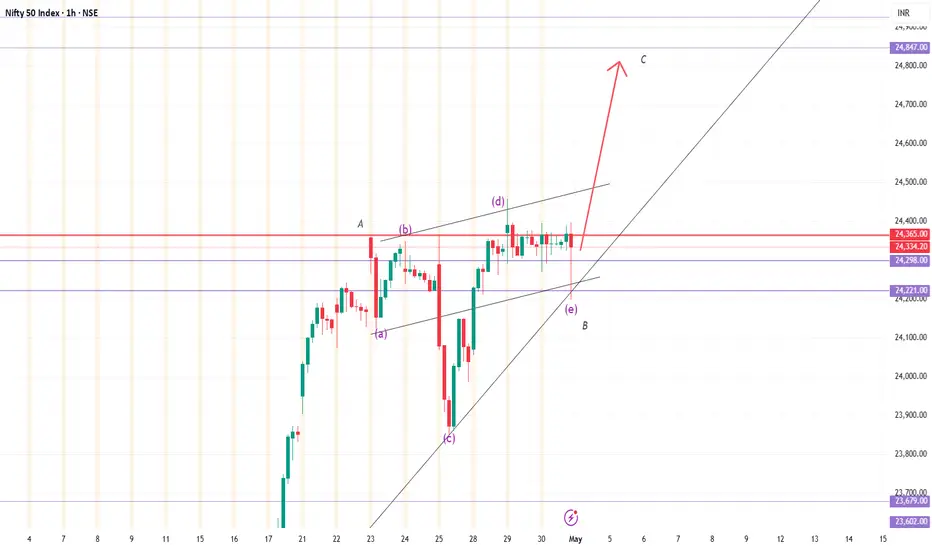
Drift Analysis (1D)It seems that DRIFT is completing wave C of a larger triangle, and wave C itself has also formed a triangle.
We are currently in wave d of C. This wave is expected to complete within the green zone, after which we anticipate moving towards the targets for wave e of C.
A daily candle closing below the invalidation level will invalidate this analysis.
For risk management, please don't forget stop loss and capital management
When we reach the first target, save some profit and then change the stop to entry
Comment if you have any questions
Thank You

possibility of uptrendThe upward trend is expected to start according to the specified directions and if the price breaks through the resistance area, confirmation of the upward trend will be possible.

check the trendThe price is expected to fluctuate within the specified range. Then there is a possibility of a trend change and the start of a downward trend.
If the price consolidates above the red resistance level, the upward trend will likely continue.

possibility of uptrendIf the price breaks through the current resistance levels, the upward trend will likely continue.
Otherwise, the downward trend will likely continue to the specified support level.

check the trendIf the price can consolidate above the current support level, the upward trend will likely continue. Otherwise, the correction will continue to the specified support levels.

possibility of correctionConsidering the price behavior within the current resistance range, possible scenarios have been identified.
As long as the price does not stabilize above the resistance range, the continuation of the downward trend will be likely.
possibility of uptrendIt is expected that a trend change will form within the specified time frame and we will witness the start of an upward trend. If the price crosses the support range, the continuation of the corrective trend will be likely.

upterndIt is expected that a trend change will form within the current support range and we will witness the start of an upward trend.
If the price crosses the support range, the continuation of the corrective trend will form.
A trend change can form within the specified time frame.

check the trendIt is expected that a trend change will take place at the current resistance level and we will witness the beginning of a correction. If the resistance level is broken, the index can advance to the next resistance level.

possibility of uptrendAs long as the price fluctuates above the green support level, the upward trend is likely to continue.
A break of the red support level will cause a continuation of the downward trend.
