Gold(based on NEo wave)on this branch of gold it is making a symmetrical and wave g is ending>
I think a good corrective wave is on the way!
Neo Wave

AKT ANALYSIS (3D)From the point marked on the chart, the STRAT correction of AKT has started. This correction appears to be a diagonal. We are currently in wave E.
We are looking for buy/long positions in the green zone. Targets are marked on the chart.
A daily candle closing below the invalidation level will invalidate this analysis.
For risk management, please don't forget stop loss and capital management
When we reach the first target, save some profit and then change the stop to entry
Comment if you have any questions
Thank You

Cardano (ADA) is on the verge of an 80% surge (1D)Despite all the positive news, it couldn’t maintain its bullish trend, as seasoned whales typically don't enter the market at the end of bullish waves.
The zone we’ve highlighted is where we believe whales will enter Cardano. Due to heavy buying pressure, the price could experience a 50% to 80% surge.
From the point marked with the green arrow on the chart, Cardano’s bullish phase has begun. It appears to be forming an expanding/diagonal/symmetrical triangle.
We are looking for buy/long positions in the green zone, where the hypothetical wave F might come to an end.
Targets are marked on the chart.
A daily candle closing below the invalidation level will invalidate our buy outlook.
For risk management, please don't forget stop loss and capital management
When we reach the first target, save some profit and then change the stop to entry
Comment if you have any questions
Thank You

NEIROETH ANALYSIS (12H)It appears that the NEIROETH diametric pattern started from the point where we placed the green arrow on the chart and completed at the point where we placed the red arrow.
Since the bullish pattern has ended and the price is below the descending trendline, sell/short opportunities can be considered in the supply zones.
The target could be the green zone.
Closing a daily candle above the invalidation level will invalidate this analysis.
For risk management, please don't forget stop loss and capital management
When we reach the first target, save some profit and then change the stop to entry
Comment if you have any questions
Thank You

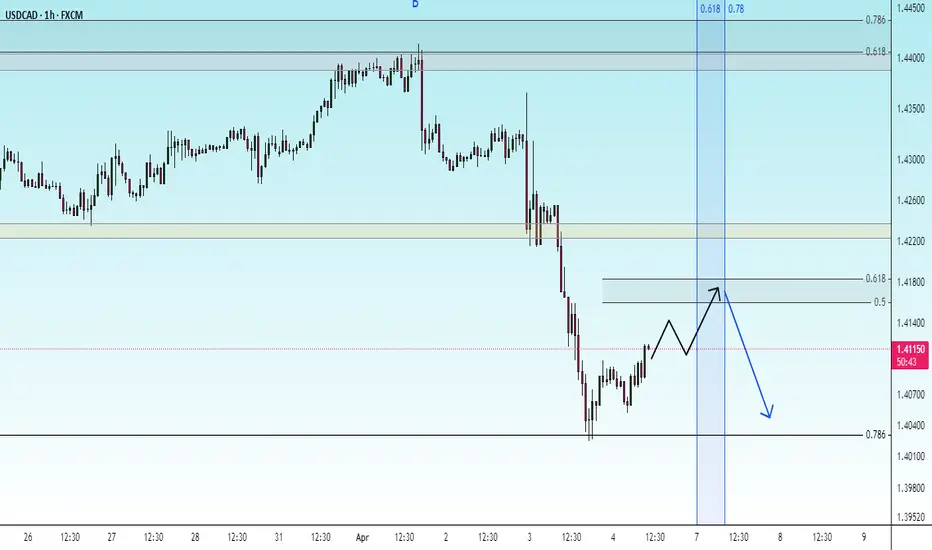
check the trendIt is expected that the upward trend will form until the specified resistance levels, then there will be a possibility of a trend change.

possibility of uptrendConsidering the price behavior within the current support range, possible scenarios have been identified. With the support range broken, a continuation of the downward trend is likely.

correctionIt is expected that the upward trend will form until the resistance levels and the specified time frame. Then there is a possibility of a trend change.
check the trendConsidering the price behavior within the specified support levels, possible scenarios have been identified. As long as the price fluctuates above the red support range, an upward trend is likely.

downtrendIt is expected that a trend change will form within the current support level and we will witness the beginning of the upward trend.
Otherwise, the continuation of the downward trend with the failure of the support level is likely.

correctionIt is expected that the corrective trend will form until the specified support levels. Then there is a possibility of a trend change and the upward trend will begin.

possibility of uptrendIt is expected that the upward trend will continue and continue until the specified resistance levels.
Otherwise, the corrective trend will form until the specified support level and then the continuation of the upward trend will be likely.

check the trendIt is expected that the trend will change within the current support area and we will see the beginning of the upward trend. Otherwise, the continuation of the downward trend is likely with the breakdown of the current support area.

uptrendIt is expected that after some fluctuation and correction within the support levels, the trend will change and we will see the beginning of the upward trend.
If the price crosses the 78.6% level, the continuation of the downward trend is likely.

uptrendIt is expected that the trend will change within the current support area and we will see the beginning of the upward trend.
As long as the price does not stabilize above the green resistance area, the continuation of the downward trend is likely.

The path of NEIRO remains bearish (1D)First of all, it's important to understand that each group of cryptocurrency tokens follows a different path NEIRO falls into the meme coin category. The performance of Layer 1 coins or other groups may differ significantly from meme coins, so keep in mind that NEIRO’s path is not the same as that of all altcoins!
Based on the point where we placed the red arrow on the chart, it seems that NEIRO's correction has started.
This corrective phase appears to be a time-consuming and exhausting symmetrical correction.
Currently, we seem to be in the middle of wave E.
The drawn path is more schematic, just to help you visualize the number and size of the waves within this corrective pattern.
The correction is expected to continue toward the lower green box, where this corrective phase is likely to end.
For risk management, please don't forget stop loss and capital management
Comment if you have any questions
Thank You

SIREN buy/long setup (4H)It appears to be inside wave D, which is a symmetrical wave.
At the bottom of the chart, there is a liquidity pool and a strong support zone.
We’re looking for buy/long positions in the green zone.
Targets are marked on the chart.
A daily candle closing below the invalidation level will invalidate this analysis.
For risk management, please don't forget stop loss and capital management
When we reach the first target, save some profit and then change the stop to entry
Comment if you have any questions
Thank You

USUAL ANALYSIS (8H)After wave A was completed, from the point where we placed the red arrow on the chart, it seems the price has entered wave B.
Wave B is a bearish symmetrical wave, and it currently appears that we are in the early stages of wave I, which is a bearish wave.
From the supply zone, we expect a rejection towards the Fibonacci levels of wave a to i, which corresponds to the green zone.
A daily candle closing above the invalidation level will invalidate this analysis.
For risk management, please don't forget stop loss and capital management
Comment if you have any questions
Thank You

usdt.d(based on Neo wave)This is the final branch of corrective wave and with breaking down 5.15 the bullish wave of crypto begins . for more information follow every counting of charts.

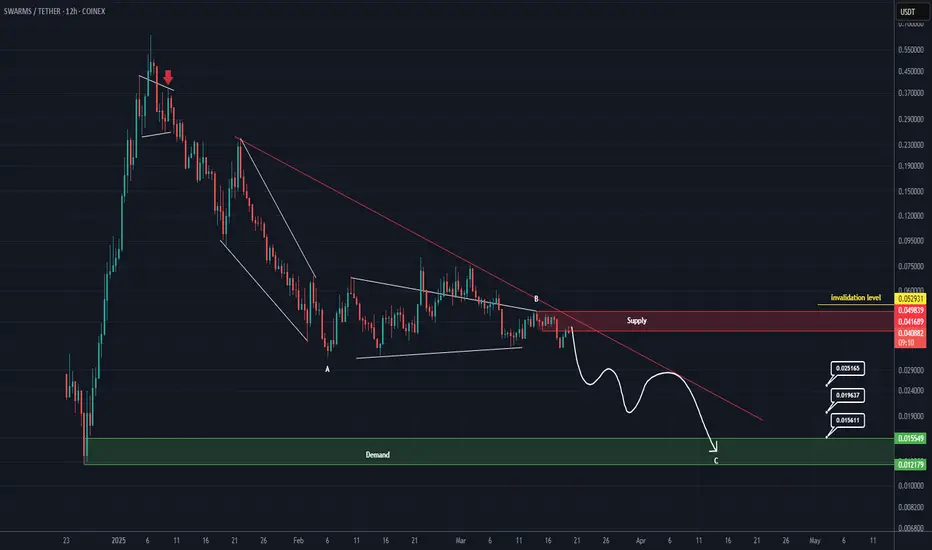
Short opportunity for SWARMS (8H)The correction of SWARM has started from the point where we placed the red arrow on the chart.
It appears that wave B has just completed, and the price is currently forming a pivot for another drop.
We expect to enter wave C soon, with the price moving towards the targets.
The closure of a daily candle above the invalidation level will invalidate this analysis.
For risk management, please don't forget stop loss and capital management
When we reach the first target, save some profit and then change the stop to entry
Comment if you have any questions
Thank You
A Closer Look at Bitcoin's Elliot Wave PatternHello friends, today we'll attempt to analyze the Bitcoin chart using Elliot Waves. Our approach will involve using Elliot Wave theory and structures, which involve multiple possibilities. The analysis we present here focuses on one potential scenario that seems possible to us.
Please note that this information is for educational purposes only and should not be considered trading advice or investment tips. There's a risk of being completely wrong, so never trade based solely on this post. We're not responsible for any profits or losses. Individuals should consult a financial advisor before making any trading or investment decisions.
Now, let's discuss the Bitcoin chart. On the daily chart, we can see that a black primary degree wave has completed its ((4th)) wave, and the ((5th)) wave has started. Within the fifth wave, an intermediate degree wave is unfolding, which will have its own set of waves (1), (2), (3), (4), (5). The primary black degree wave five will be complete once the intermediate degree wave is finished.
We've drawn accounts on the chart, illustrating the entire structure, including the nearest invalidation level at around $76,666 and the real invalidation level below $50,000.
I hope this analysis based on Elliot Wave theory has helped you understand the chart better and learn something new. Please keep in mind that this is for educational purposes only.
I am not Sebi registered analyst.
My studies are for educational purpose only.
Please Consult your financial advisor before trading or investing.
I am not responsible for any kinds of your profits and your losses.
Most investors treat trading as a hobby because they have a full-time job doing something else.
However, If you treat trading like a business, it will pay you like a business.
If you treat like a hobby, hobbies don't pay, they cost you...!
Hope this post is helpful to community
Thanks
RK💕
Disclaimer and Risk Warning.
The analysis and discussion provided on in.tradingview.com is intended for educational purposes only and should not be relied upon for trading decisions. RK_Charts is not an investment adviser and the information provided here should not be taken as professional investment advice. Before buying or selling any investments, securities, or precious metals, it is recommended that you conduct your own due diligence. RK_Charts does not share in your profits and will not take responsibility for any losses you may incur. So Please Consult your financial advisor before trading or investing.

REZ Analysis (8H)After the iCH formed on the chart, it seems we are in parts of wave C, which, after absorbing liquidity from lower areas, could push the price upward and complete the bullish segments of wave C.
We are looking for buy/long positions around the green zone; however, reaching this area might take some time, so this asset should be kept on the watchlist.
A daily candle closing below the invalidation level will invalidate this analysis.
For risk management, please don't forget stop loss and capital management
Comment if you have any questions
Thank You

SEI New Update (1D)This analysis is an update of the analysis you see in the "Related publications" section
Considering the strength of the wave and the status of Bitcoin and other key indices, we have slightly lowered the support zone, as this coin may form a deeper correction for wave C.
We have also updated the targets.
Let’s see what happens.
For risk management, please don't forget stop loss and capital management
When we reach the first target, save some profit and then change the stop to entry
Comment if you have any questions
Thank You

ONDO looks bullish (1D)ONDO appears to be in wave D of a larger pattern (possibly a triangle).
Wave D seems to be a diametric or symmetrical structure. This diametric may complete in the green zone, leading to an upward reversal.
We are looking for buy/long positions in the green zone. Targets are marked on the chart.
A daily candle closing below the invalidation level will invalidate this analysis
For risk management, please don't forget stop loss and capital management
When we reach the first target, save some profit and then change the stop to entry
Comment if you have any questions
Thank You
