uptrendIf the price changes direction within the current support range, the start of an upward trend is likely, and by passing the previous ceiling range, confirmation of the upward trend will be formed.
Neo Wave

uptrendIt is expected that the corrective pattern will end in the current support area and then the beginning of the upward trend will be formed.
If the index crosses the support area, the continuation of the corrective trend will be likely.

possibility of uptrendIt is expected that the triangle pattern will form according to the specified paths, then there will be a possibility of a trend change and the beginning of the upward trend.
If the price crosses the support area, the continuation of the downward trend will be likely.
correctionIt is expected that the trend change will form in the current support area and we will see the start of the upward trend.
If the price crosses the specified support levels, the continuation of the downward trend will be likely.

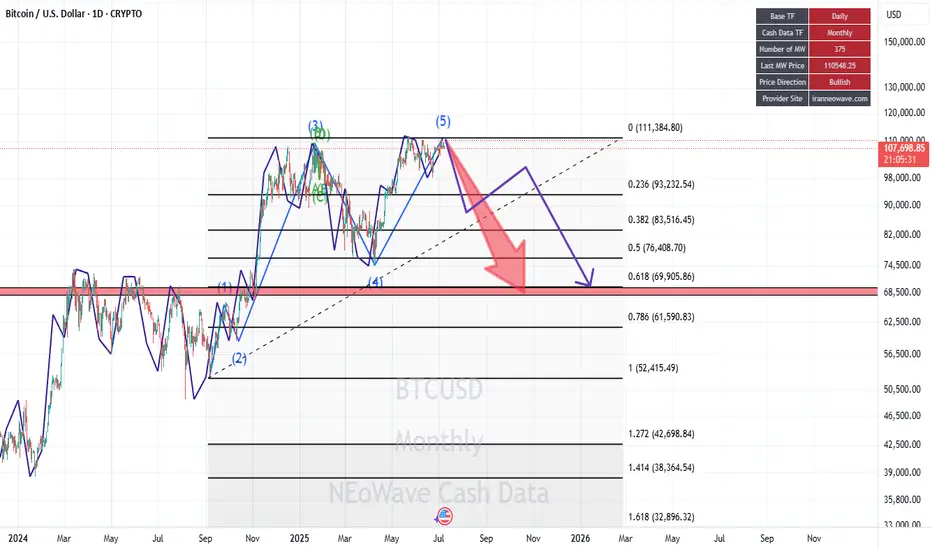
BTCUSDBased on NeoWave Analysis:
We should wait for the end of wave 5, getting ready for a Sell position.
EURUSDBased on NeoWave analysis:
Either we are in ABC-X-ABC wave --> so, after B, we get a Buy position for C
Or we are in ABCDE wave --> so, after D, we get a Buy position for large E

Check the trend It is expected that a trend change will form at the current resistance level and a continuation of the downtrend will form. Otherwise, the continuation of the uptrend to the specified resistance levels will be possible and then there will be a possibility of a trend change at the specified resistance levels.

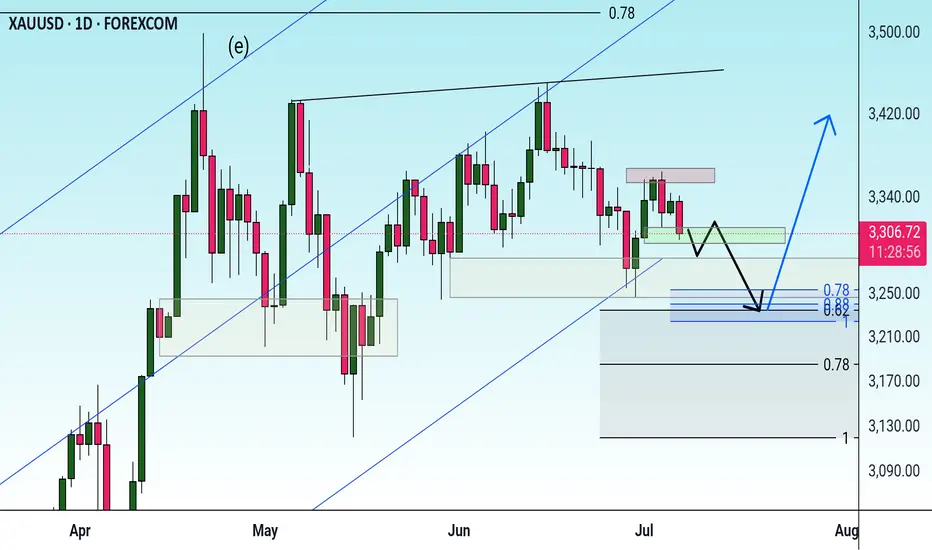
Correction The price is expected to break through the green area and decline to the indicated Fibonacci levels. Then there is a possibility of a trend change and the start of an uptrend.
Uptrend The uptrend is expected to continue to the identified resistance levels. Then, based on the price behavior within this range, possible scenarios are identified.

Possibility of uptrend Wave B is expected to complete within the support area and the specified timeframe, and then we will see the start of the uptrend. A break above the 78.6% level will invalidate the above scenario.

Possibility of uptrend It is expected that a trend change will take place within the green support area and we will witness the start of an upward trend. Otherwise, the correction trend will continue to the next support levels.

Check the trend It is expected that the correction will end at the current support level and we will see the start of an uptrend. Otherwise, the correction may continue to the specified support levels. Then there is a possibility of a trend change.

Uptrend It is expected that after some fluctuation in the support area and time frame, a trend change will occur and we will see the start of an uptrend.

Upward trend Given the behavior of the index within the current resistance range, possible scenarios have been identified. It is expected that a trend change will take place and we will witness the beginning of a correction. With consolidation above the resistance range, the continuation of the upward trend will be likely.

Possibility of correction The uptrend is expected to continue to the specified resistance levels. Then, a trend change and the start of a downtrend are likely. If the price consolidates above the resistance level, the uptrend may continue.

Check the trend The correction is expected to progress to the specified support level. Then there is a possibility of a trend change and the start of an upward trend.

TIA Coin: Unlock 118% Profit Potential (1D)From the point where we placed the red arrow on the chart, it appears the TIA correction has begun.
Despite the current bullish market trend, TIA has not yet experienced a pump, and it seems the price hasn't reached its bottom yet. This correction seems to follow a large, time-consuming diamond-shaped diametric pattern, and we are currently in the early or middle stages of wave G.
Recently, the price lost a minor trendline, marked with a red dotted line, indicating that wave G might continue its path.
We have identified a low-risk buy zone on the chart for catching the next bullish wave in TIA. We are targeting buy/long positions in this zone.
Price targets are clearly indicated on the chart.
A daily candle close below the invalidation level will invalidate this analysis and suggest a potential reversal.
invalidation level: 1.089$
For risk management, please don't forget stop loss and capital management
When we reach the first target, save some profit and then change the stop to entry
Comment if you have any questions
Thank You

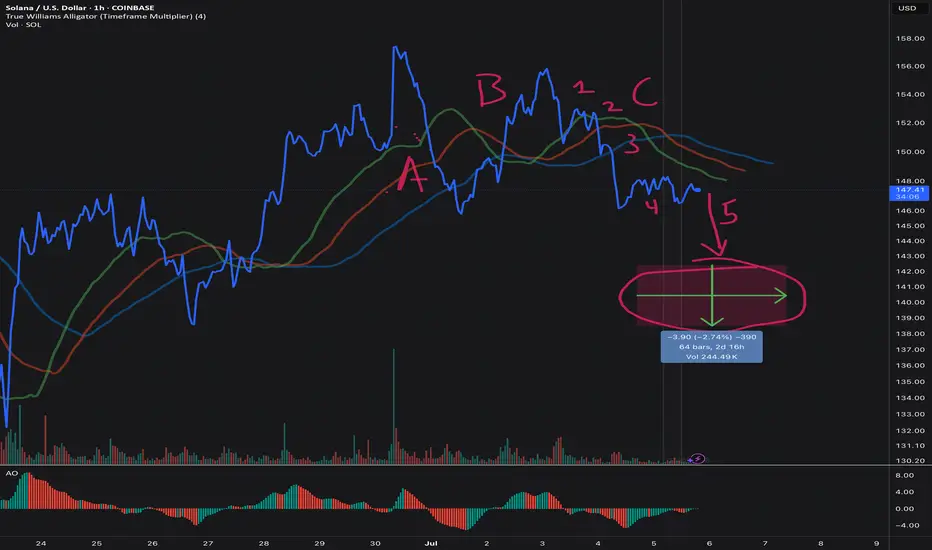
SOL Short Trading Setup: The Alligator Awakens!
Wave 4 wedge forming — watch for breakdown. Neely rules and Alligator indicator confirm setup.
SOL Trading Setup: The Alligator Awakens! 🐊
The Chart Breakdown
Looking at this SOL/USD hourly chart, we’ve got a textbook Elliott Wave setup using the Williams Alligator and Neely’s NeoWave rules .
The Wave Count Story
ABC : That larger three-wave rally? Done and dusted. ✅
1-2-3-4-(5) : We're now in a five-wave decline, currently sitting in wave 4.
Neely Rules Check ✔️
Price & Structure:
Wave 3 is not the shortest: travels farther than wave 1 and exceeds projected wave 5 → ✅
Alternation: Wave 2 was a sharp ABC; Wave 4 is a flattening wedge/triangle → textbook alternation ✅
No overlap: Wave 4 doesn’t enter wave 1 territory → clean as a whistle ✅
Equality guideline: The green box shows −2.74 %, mirroring wave 1 → picture-perfect ✅
Time Rules (Neely’s most overlooked):
Wave 4 has taken ~25 bars vs. wave 2’s ~15 bars → passes the time-ratio test ✅
Wave 5’s projected end falls within the vertical marker from wave 4’s high → on schedule ✅
Alligator & AO Confirmation 🐊
Alligator lines compressing during wave 4 → energy is building
AO divergence: red bars deepen in wave 3, shrink in wave 4 → classic wave 5 setup
The Trading Plan 🎯
Entry Strategy:
• Stop-limit sell just below wedge support (~$147)
Risk Management:
Stop Loss: One ATR above wave 4 high — protects against a throw-over
Time Stop: Exit at market if not in profit after 70 bars
Profit Targets:
TP-1: 100 % of wave 1 length (green arrow)
TP-2: Trail stop if AO shows bullish divergence near target zone
The Caveat ⚠️
If wave 4 drags on much longer (>2× its current length), it could evolve into a complex correction. Time is key — watch that clock.
Bottom Line
This setup checks all the NeoWave impulse boxes. The structure is clean. The Alligator is asleep. And we’re approaching a wedge break.
Short the break, target the equality zone, and respect your time stop.
Good traders follow rules. Great traders follow Neely rules. 😉
Agree or disagree? Drop a comment or share your chart!
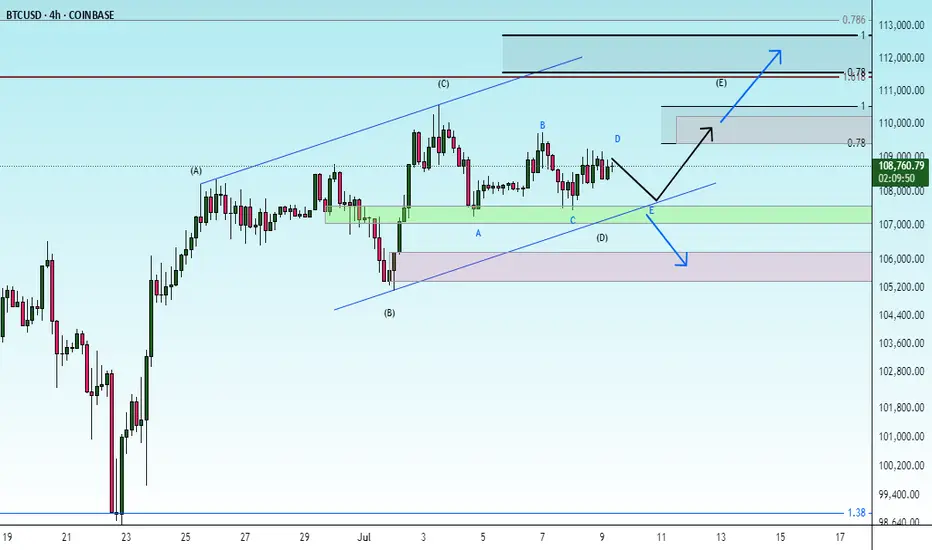
BTC Analysis (4H)This analysis is an update of the analysis you see in the "Related publications" section
Since the red arrow was placed on the chart, Bitcoin's bullish phase has ended and it has entered a corrective phase. This correction appears to be forming a Diametric pattern, and we are currently in the middle of wave E.
After interacting with the demand zone, the price may move toward the specified targets.
A daily candle closing below the invalidation level will invalidate this analysis.
For risk management, please don't forget stop loss and capital management
Comment if you have any questions
Thank You

USA Economy Long-Term Outlook:The long-term outlook for the U.S. economy , as of mid-2025, is characterized by several key factors and some uncertainty, particularly around tariffs and monetary policy.
GDP Growth: The U.S. economy experienced a contraction in Q1 2025 (down 0.2-0.5% GDP), the first in three years, partly due to a surge in imports and a sharp cutback in consumer spending. Economists anticipate a bounce back in Q2 2025 (forecasted at 3% growth). However, the overall expectation for 2025 is for growth to decelerate significantly (e.g., Vanguard projects 1.5% GDP growth for year-end 2025, EY forecasts 1.5%, Trading Economics 1.7%, J.P. Morgan 2.1%). The second half of 2025 is expected to see a "pronounced demand cliff" due to front-loaded purchases ahead of anticipated trade restrictions.
Inflation: Tariffs are a significant factor impacting inflation. CPI growth is expected to average around 2.9% in 2025 and potentially accelerate to 3.2% in 2026, moderating to around 2.3% by 2029 (Deloitte). Core PCE inflation is expected to climb to the 2.8-3.0% range year-over-year in Q3 2025 - Q3 2026 as tariffs filter through the economy (University of Michigan). The Federal Reserve is closely watching tariff-induced price spikes.
Interest Rates/Monetary Policy: The Federal Reserve is likely on hold with interest rates for now, but two more rate cuts are anticipated later in 2025 if the labor market remains stable (Vanguard). Some forecasts suggest the Fed will resume cutting rates in July 2025, reaching a terminal range of 3.25-3.5% by mid-2026 (University of Michigan). However, the uncertainty around tariffs and their impact on inflation could influence the Fed's decisions.
Labor Market: The labor market has been cooling but remains stable. The unemployment rate is expected to increase throughout 2025, potentially reaching 4.3% (Morningstar), 4.7% (Vanguard), or even 4.8% by year-end (EY). Job gains are predicted to decelerate significantly in the second half of 2025 due to tariffs.
Tariffs: Tariffs are a major source of uncertainty. While some recent de-escalation in trade policy with China has led to positive revisions in the outlook, the long-term impact of tariffs remains a concern, with potential to lower GDP growth, raise inflation, and weaken the labor market. The expectation is that tariffs will be at least modestly higher than at the start of 2025.
In essence, the long-term economic forecast for the USA suggests continued growth, but at a more moderate pace than recent years, with ongoing vigilance required for inflation and labor market dynamics, heavily influenced by evolving tariff policies.

Possibility of correction Given the behavior of the indicator within the current resistance range, possible scenarios have been identified. If the resistance range is broken, an upward and fluctuating trend to the red resistance range is likely.

Check the trend Given the price behavior within the current resistance range, possible scenarios have been identified. It is expected that after some fluctuation within the current resistance range, a trend change will take place and we will witness the beginning of a downtrend. With consolidation above the resistance range, an uptrend will be likely.

Possibility of uptrend The triangle pattern is expected to complete at the current support level according to the indicated directions. Then, a trend change is likely to occur and the start of an uptrend is likely. A break of the red support level will likely indicate a continuation of the downtrend.
