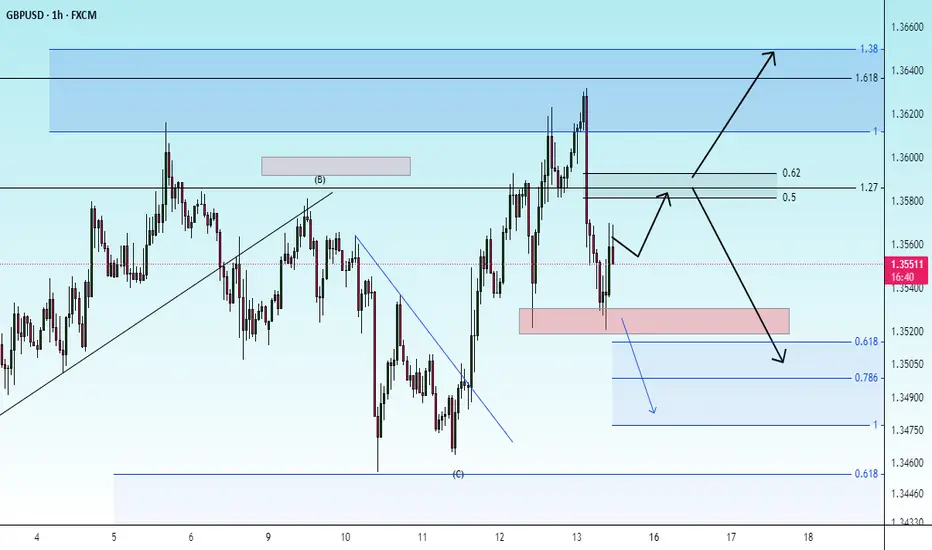
check the trendIt is expected that the corrective trend will move according to the specified direction and continue to the specified Fibonacci levels. Then a continuation of the upward trend will be possible.
A consolidation above the green resistance zone will confirm the bullish trend.
Neo Wave

possibility of uptrendIt is expected that a trend change will form within the current support area and we will witness the beginning of the upward trend. If the price breaks through the support area, a continuation of the downward trend to the next support area is possible.

check the trendThe upward trend is expected to continue to the specified resistance levels. Then there is a possibility of a trend change.
If the price breaks through the support area, a continuation of the downward trend to the specified support levels is possible.
possibility of correctionIt is expected that a trend change will take place in the current resistance range and we will witness the beginning of a downward trend. If the price consolidates above the resistance range, the continuation of the upward trend is likely.

possibility of correctionConsidering the price behavior in the current support range, there is a possibility of an upward trend. Otherwise, the continuation, with the support range broken, of a continuation of the downward trend is likely.

correctionConsidering the price behavior in the current support range, possible scenarios have been identified.
The possibility of a continuation of the downward trend to the green support range is possible.

possibility of correctionAs long as the indicator below the green resistance range fluctuates, the continuation of the correction trend will be likely. With the consolidation above the resistance range, the continuation of the upward trend will be likely.

check the trendIt is expected that the upward trend will advance to the specified resistance range. Then there will be a possibility of a trend change. If the price crosses the resistance range, the continuation of the upward trend will be likely.

correctionIt is expected that after some fluctuation and rise, a trend change will form in the specified resistance range and we will see the continuation of the downward trend.

Where is Ethereum's target? (1D)This analysis is an update of the analysis you see in the "Related publications" section
The previous analysis has expired, and the price moved up without any correction. This type of movement is usually intended to attract liquidity, and once liquidity is absorbed, the price often goes through a correction.
From the point where we placed the green arrow, Ethereum has entered a bullish phase.
It now appears that we are in wave B of this bullish phase. The price may get rejected from the red zone.
Price can be rejected from the red box.
Do not enter any positions without confirmation, as the price may even continue moving up to the top of the red box.
For risk management, please don't forget stop loss and capital management
When we reach the first target, save some profit and then change the stop to entry
Comment if you have any questions
Thank You

BTC.D(based one NEowave)the Z wave of this branch shown as a triangle and I think its finished but for confirmation breaking the 61.9 is important.
its a green light of Altseason.

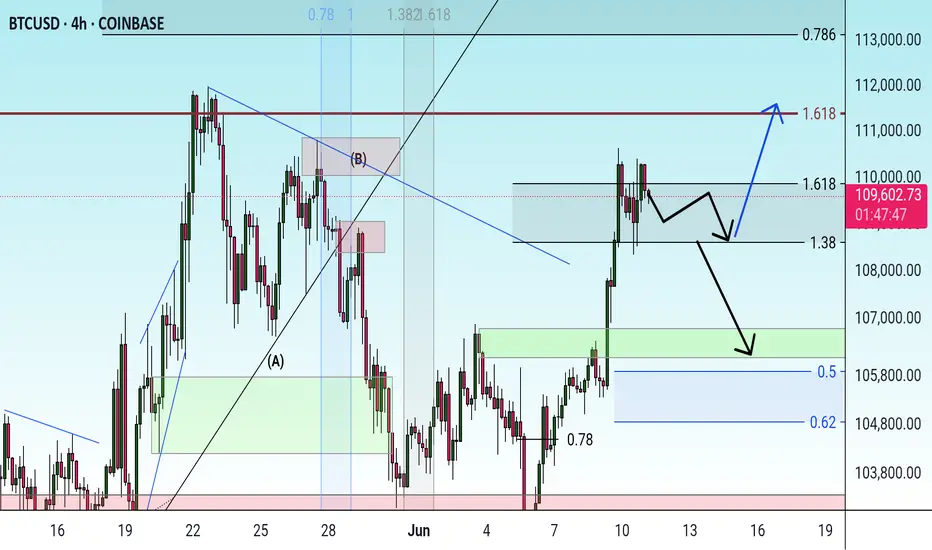
Will Bitcoin move toward its ATH?This analysis is an update of the analysis you see in the "Related publications" section
In the previous analysis, we mentioned that the red zone marked on the chart could potentially be broken.
From the point where we placed the green arrow on the chart, Bitcoin’s diametric pattern has completed, and it has entered a corrective phase.
It now appears that we are in wave B of a running flat, and wave B could complete around the all-time high or slightly above it.
Let’s see whether this move will play out or not.
For risk management, please don't forget stop loss and capital management
Comment if you have any questions
Thank You

Possibility of uptrend It is expected that after some fluctuation and correction in the support area, a trend change will take place and we will witness the start of an upward trend. A break of the green resistance area will be a confirmation of the upward trend. Otherwise, the continuation of the corrective trend to the support areas will be possible.

Check the trend It is expected that a trend change will occur at the current resistance level and we will see a continuation of the downtrend. If the price breaks through the resistance level and consolidates above the resistance level, a continuation of the uptrend is likely.

Check the trend A trend change is expected to form within the current support area and we will see the start of an uptrend. A consolidation above the blue trend line will confirm the uptrend.

Correction The recent downtrend could end within the specified support levels and we could see the start of an uptrend. If the price breaks through the 100% level, a continuation of the downtrend is likely.

Possibility of uptrend It is expected that after some fluctuation, the upward trend will start and will advance to the previous ceiling. In this case, the continuation of the upward trend will be likely. If the price breaks through the support area, the continuation of the downward trend and correction will be possible.

Possibility of uptrend It is expected that after some fluctuations and corrections within the current range, the continuation of the upward trend will take place. Confirmation of the upward trend will be the consolidation of the price above the resistance range. Otherwise, the continuation of the downward trend to the specified support ranges will be possible.

Possibility of uptrend The price is expected to consolidate above the current resistance level and then continue its upward trend. Otherwise, a correction to the indicated support level is possible.

Upward trend After some fluctuation and correction to the specified support level, there is a possibility of a trend change. Then the start of an uptrend is likely. Otherwise, if the support level is broken, the downtrend may continue to the next support level.

Possibility of correction It is expected that after some fluctuation and correction, the upward trend will continue. If the price breaks through the support zone, the downward trend will continue to the next support zone.
Check the trend A corrective and fluctuating trend is expected to form. Then there is a possibility of a trend change and the start of an uptrend. If the price breaks the green support zone, a continuation of the downtrend is likely.
Japan’s Metaplanet to Invest $5.4 Billion in Bitcoin: A Bold StrAmid growing global interest in cryptocurrencies, Japanese investment firm Metaplanet has announced plans to invest $5.4 billion in Bitcoin. This strategic move places the company alongside the largest corporate Bitcoin holders and reflects Japan’s evolving financial stance, where digital assets are beginning to play a more prominent role.
According to Metaplanet, the firm intends to acquire approximately 210,000 BTC by 2027, representing nearly 1% of Bitcoin’s total supply, which is capped at 21 million coins. This initiative is aimed at hedging against inflation and the depreciation of the yen, while also strengthening the company’s position in global financial markets.
Unlike traditional funds, Metaplanet is committed to a long-term holding strategy (hodling) rather than speculative trading. This signals growing confidence in Bitcoin as a store of value comparable to gold. The company also anticipates increasing institutional demand and the potential recognition of Bitcoin as a reserve asset by central banks.
This move is also seen as a step toward legitimizing Bitcoin across Asia. Analysts suggest that other Japanese and South Korean companies may soon follow Metaplanet’s lead.
The $5.4 billion Bitcoin investment is more than a financial move—it’s a statement about the future. Metaplanet is showing that digital assets are becoming an integral part of modern macroeconomic strategy.
