BTC(based on NEo wave)I think wave G is finished and soon it will pump to 138K.
stop loss is 115500.
attention:138K is the first target of these bullish waves.
Neowaveanalysis
Bitcoin (BTCUSDT) - Possible Completion of a Complex CorrectionTimeframe: 4H + 1H
Methodology: NeoWave (Glen Neely) + Smart Money Concepts (ICT/SMC)
Posted by: @CryptoPilot
⸻
🧠 NeoWave Analysis: Complex Correction Ending?
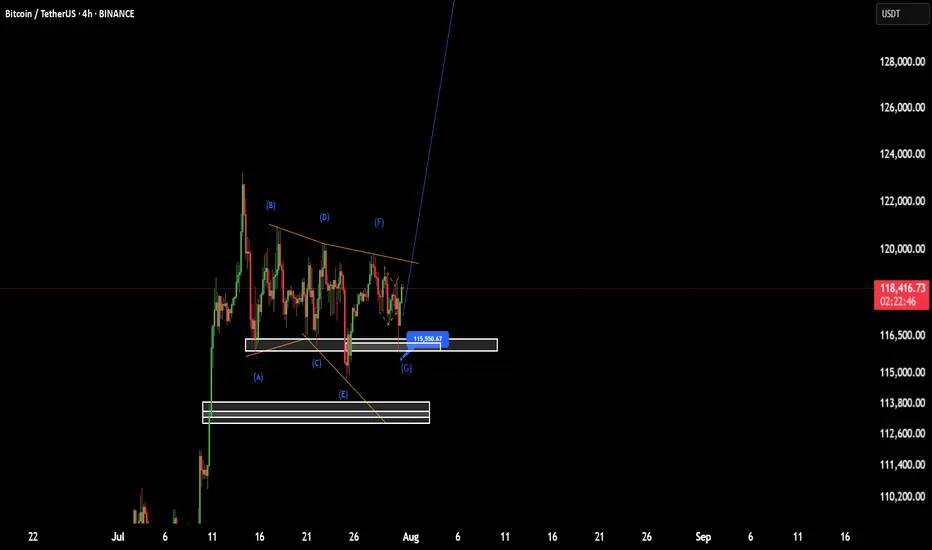
From a NeoWave perspective, BTC seems to be in the final stages of a Complex Correction that started in March 2025 from ~72k. The upward move appears to form a Contracting Diametric structure (7 legs: A–B–C–D–E–F–G), with the current leg G potentially unfolding now.
• ✅ Wave A: Sharp recovery from March lows
• ✅ Waves B–F: Alternating corrective legs with varied time and complexity
• 🔄 Wave G: Could be starting now, expected to break structure to the downside
This suggests that the entire move from March till now may represent a large Wave B, setting the stage for a deeper Wave C down.
⸻
🔍 Price Action + Smart Money Confluence
The following observations strengthen the NeoWave scenario:
• 🟨 Liquidity Pools above 120k were swept recently, creating a potential Buy-side Liquidity Grab
• 🟥 Imbalance/FVGs below 114.5k remain unfilled
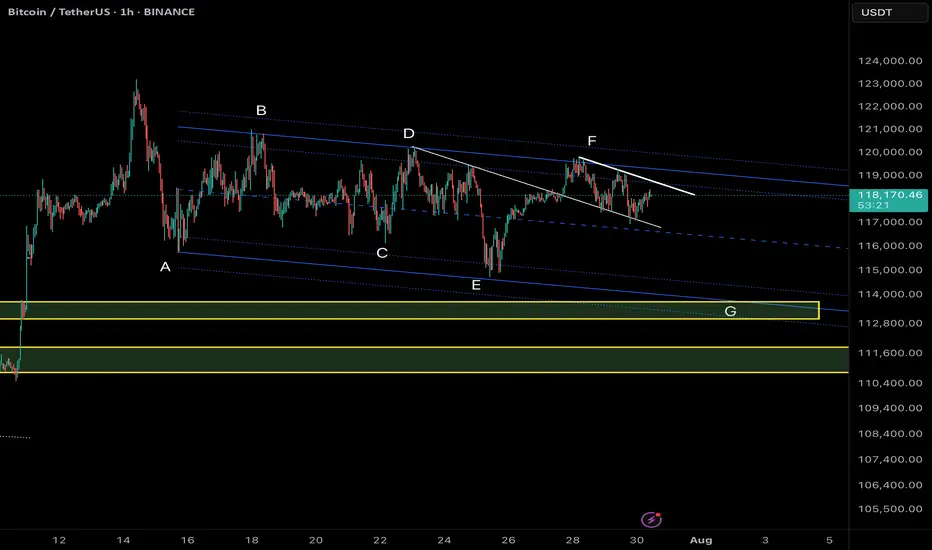
• 🔻 Market Structure Shift (MSS) evident on 1H chart — lower highs forming
• 🧠 Price rejected from a key Supply Zone, aligning with end of Wave F
• 🟩 If price re-tests the internal bearish OB (near 119.5k–120k), it may provide an ideal short trigger
⸻
📌 Key Levels to Watch:
Level
Description
120.2k
Liquidity sweep zone / MSS confirmed
118k
Current structure base (pivot)
114.5k
FVG + potential Wave G target
111–112k
Strong demand zone (accumulation support)
🧭 Scenario Outlook:
Primary:
→ Price is in Wave G of a Diametric (NeoWave)
→ Likely to unfold as a 3-leg Zigzag down or a Complex combination
→ Objective: break below Wave E low and target the unmitigated imbalances
Alternative:
→ Extended Flat or Triangle, if 120.5k is broken impulsively
→ Invalidation = clean break and hold above 121k
⸻
⚠️ Risk Note:
This analysis assumes Wave G is beginning. If bulls manage to reclaim 120.5k with momentum and close above, the bearish structure will be invalidated.
⸻
💬 Final Thought:
We are potentially nearing the end of a complex corrective rally. The confluence of NeoWave structural symmetry, Smart Money traps, and market inefficiencies suggests that BTC may be preparing for a retracement. Stay alert for confirmations before executing.
⸻
📌 Follow @CryptoPilot for advanced wave structure updates, market geometry insights, and ICT-style smart money traps.
💬 Share your views or alternate wave counts in the comments!
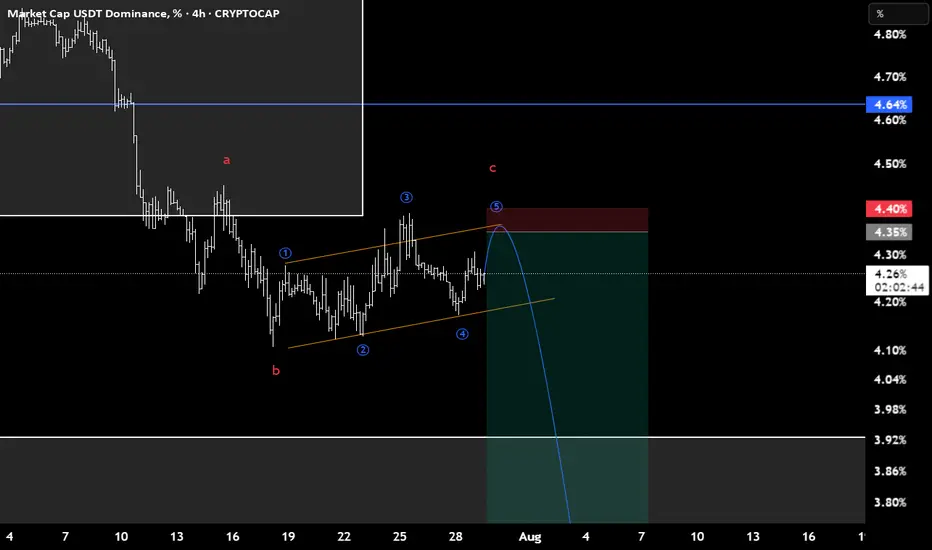
USDT.D(based on NEo wave)I consider this branch as a flat and c wave is the terminal with 3rd extended.
stop loss is 4.4.
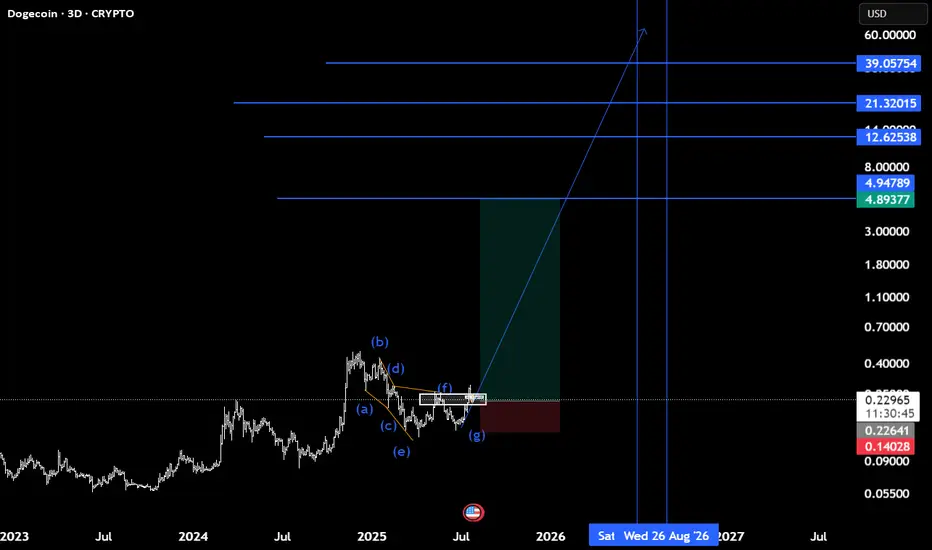
Doge(based on NEo wave)confirmation of finishing the E wave of triangle is here now.
it takes about 400 days for all targets to pass.
see the related last chart of doge.
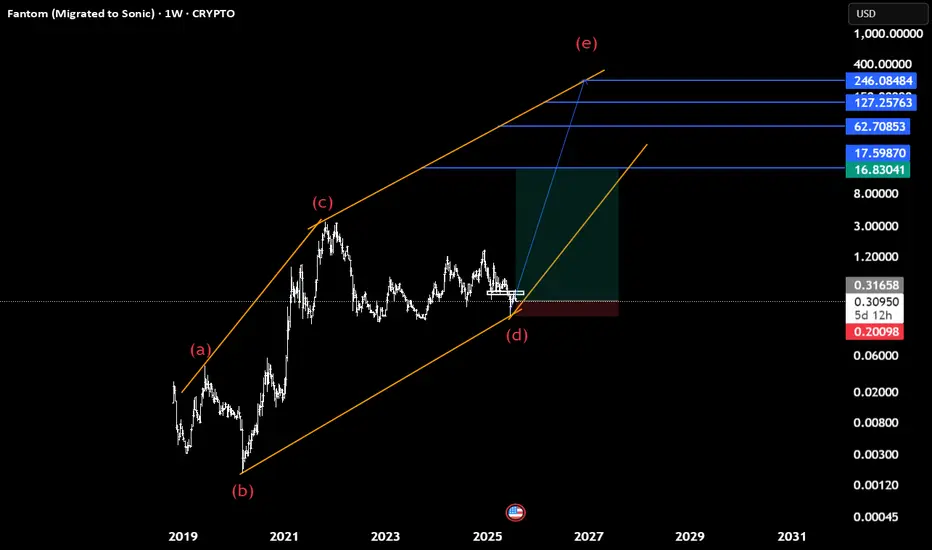
Sonic(based on NEo wave)Soon Sonic will start heavy bullish waves to the targets which shown with blue lines.
95% it is a diamnod diametric and we cant consider this as descending triangle because there is no overlap between wave d and a.
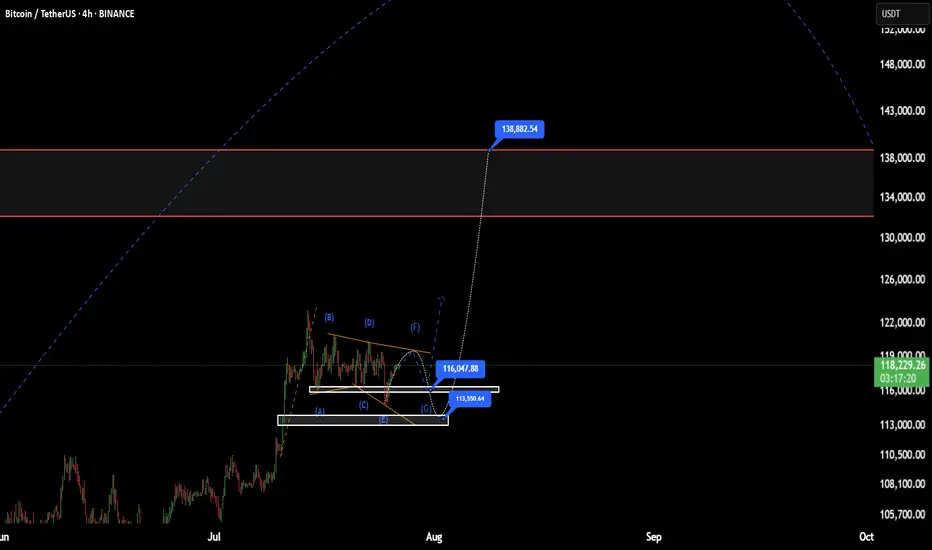
BTC(based on NEo wave)This range price is shown as a bow-tie diametrical.
I think G wave will end at one of those prices, 113 or 116
after this it will start a good bullish wave.
stop loss is 110K and the first target is 138K.
Saham PTBA: Tunggu Sinyal lenkap dgn 5 Peluru📊 Stock Analysis of PTBA Bukit Asam Tbk. using Profitmore Trade™'s 5 Bullets Strategy:
🔹 1. Zero Line
🔹 2. AO Divergence
🔹 3. SQUAT
🔹 4. Fractal
🔹 5. Momentum
🔍 Market Segmentation Analysis:
📅 Monthly: Even segment
📅 Weekly: 8 even segments (Monthly timeframe)
📅 Daily: Corrective even segment (2 waves) after a bearish odd segment
⚠️ Not Yet Time to Enter! The 5 Bullets signals are not yet complete. Wait ~2 weeks for confirmation of optimal entry conditions.
📌 Odd & Even Segment Theory: Even segments typically last as long as or longer than odd segments. Monitor the market closely!
#ProfitmoreTrade #StockAnalysis #PTBA #TradingView #TechnicalAnalysis #IndonesianStocks

Cardano and Diametric Pattern
We are currently in wave-g of the Diamond Diametric and it could continue to 0.43.
After the completion of the Diametric, if the Double Combination pattern does not form, we expect an uptrend to form. (The post-pattern movement will show us whether the Diametric has completed or not).
Good luck
NEoWave Chart

BTC.D(based one NEowave)the Z wave of this branch shown as a triangle and I think its finished but for confirmation breaking the 61.9 is important.
its a green light of Altseason.

ADA(based on NEowave)this branch of Cardano is diamond diametrical but I didnt count the other branches and the larger degrees but based on ETH and other Altcoins I think it will pump soon.

Doge(based on NEowave)like ETH wave E is ending and soon it will start a huge bullish wave.
wave E look likes a bow-tie diametrical and wave g is at the end which is the last chance to buy.

USDT.D(based on NEowave)I think wave E of triangle touched the necessary high and crypto is ready for a big pump.
pay attention to the targets and stop loss!

SUSDTAnalysis is the same analysis, it just seems like the type of pattern is different... we have another low and then a high...

BTC Neowave analysis - 8 JuneAssuming wave D has completed, two potential scenarios can be considered for the development of wave E:
1. Contracting Triangle Scenario:
We are currently in the final wave (wave e ) of the triangle. Upon its completion, either wave a of E or the entire wave E could be considered complete. Confirmation of this scenario would be a strong breakout below 105,000 with solid momentum. However, this scenario would be invalidated if the price moves beyond 107,000.
2. Diametric Scenario:
If the price surpasses 107,000 or if the breakout below 105,000 lacks sufficient momentum (e.g., takes more than one day to play out), this alternative becomes more plausible. It suggests a 7-leg structure. In this case, waves f and g are expected to take approximately one to one and a half days each.

SUSDT - 1WThe previous bullish analysis failed and I currently expect a correction to the range of 0.3 to 0.33 cents...

ETH(based on NEowave)I changed my analysis and I think Its better to consider eth in the middle of the running diamond diametrical.
stop loss of this analysis is 2400$.

Solana(based on NEowave)I consider this as a triangle but under the price zone which is 139 it tells us its going to make a diamond diametrical.

SUSDTAfter forming a Diametric pattern and then correcting after that, the price is now ready to move to the specified range...

ETH(based on NEowave)now the E wave of that cycle triangle looks like also a triangle.(if you dont know what Im talking about check the last analysis of ETH)
if e wave of this triangle breaks the SL it turns to a diamond diametrical.

Will the Euro weaken against the US Dollar?EURUSD has started a price and time correction since July 28, 2008 in the form of a diametric pattern.
Wave-(f) currently appears to be forming. We see two price ranges for the end of wave-(f) in terms of price:
a - range 1.15758-1.17173
b - range 1.21357-1.23505
After the completion of wave-(f) we expect wave-(g) to continue to the specified range.
Good luck
NEoWave Chart

Has the Alt Season Started?Cash Data 1W
By analyzing the weekly Cash Data chart of TOTAL3, we observe that after a rapid and significant rise, a correction in TOTAL3 has begun, which appears to be forming a Neutral Triangle pattern.
Wave Analysis:
Wave-(c) is a double pattern with a small X-wave, making it the most complex wave. However, there is a possibility that wave-(d) could become more complex than wave-(c). We are currently in wave-(d). Given that wave-(b) has surpassed the start of wave-(a) and wave-(c) has been fully retraced by wave-(d), there is a likelihood that a Running Neutral Triangle is forming. For confirmation, wave-(d) must exceed the starting point of wave-(c).
Conclusion:
Based on the analysis, wave-(d) could rise to the range of 1.14–1.38 trillion USD. Subsequently, wave-(e) will begin and may conclude within the retracement zones identified on the chart. To accurately determine the target for wave-(e), we need wave-(d) to complete, allowing us to predict the end of the Running Neutral Triangle with greater precision.
After the completion of the Running Neutral Triangle, we expect a significant rally in altcoins.
Good luck
NEoWave Chart

ETH(based on NEowave)Im sharing this because wave D is at the end and in the next 2 month you can see the main movement which is the start of wave E.
wave E takes about 350-450 days but after that there is a big and longtime bearish wave!

A larger corrective pattern is formingIn the previous analysis, a specific range was determined for the price to reverse, after reaching that price range, the price jumped upwards and the price grew by 1700 pips. However, considering that the structure of wave-c is not an impulse, the zigzag was not confirmed and it seems that a larger corrective pattern is forming.
It seems that the reverse contracting triangle pattern is forming, which is currently in wave-d of the triangle. With the completion of wave-d, we can better find the end point of wave-e.
