End of GOLD correction#GOLD #XAUUSD
UPDATE
As I mentioned earlier, gold was forming a contracting triangle.
The wave-(e) of the triangle has formed a double pattern diametric-X-triangle and has moved beyond my expectations (the post-pattern movement has passed ), breaking the trendline of (a)-(c). However, since it did not exceed the end of wave-(c), the contracting triangle has not been invalidated.
We expect gold to gradually rise from this range and surpass $3,500.
Good luck
NEoWave Chart
Neowaveforecast

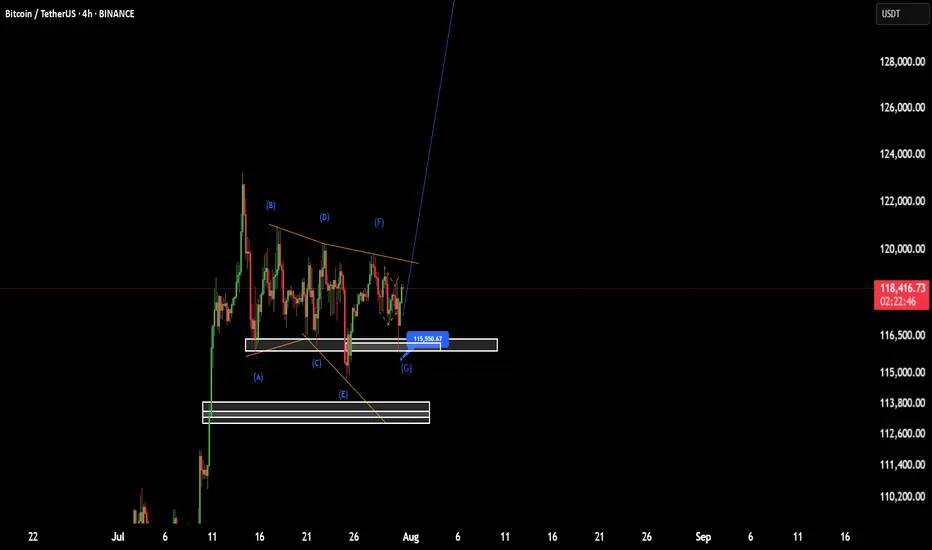
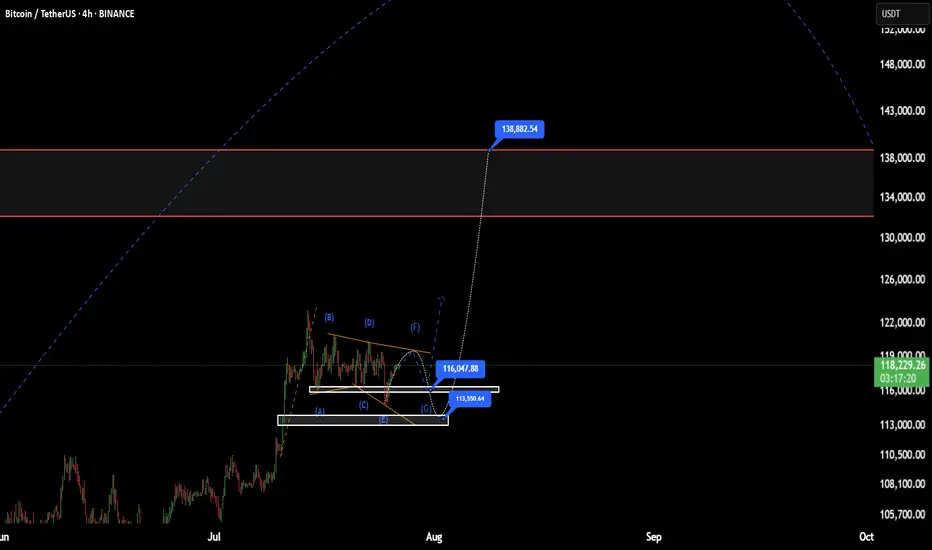
BTC(based on NEo wave)I think wave G is finished and soon it will pump to 138K.
stop loss is 115500.
attention:138K is the first target of these bullish waves.
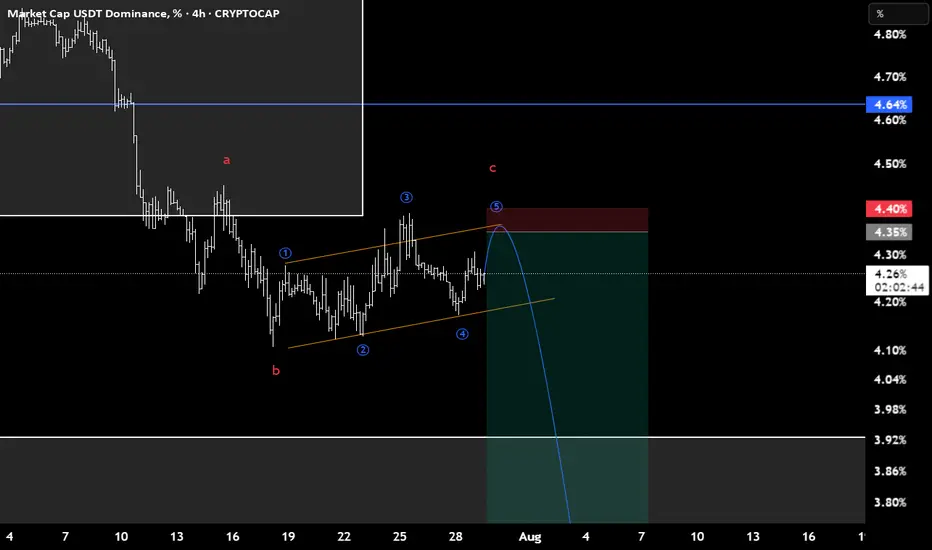
USDT.D(based on NEo wave)I consider this branch as a flat and c wave is the terminal with 3rd extended.
stop loss is 4.4.
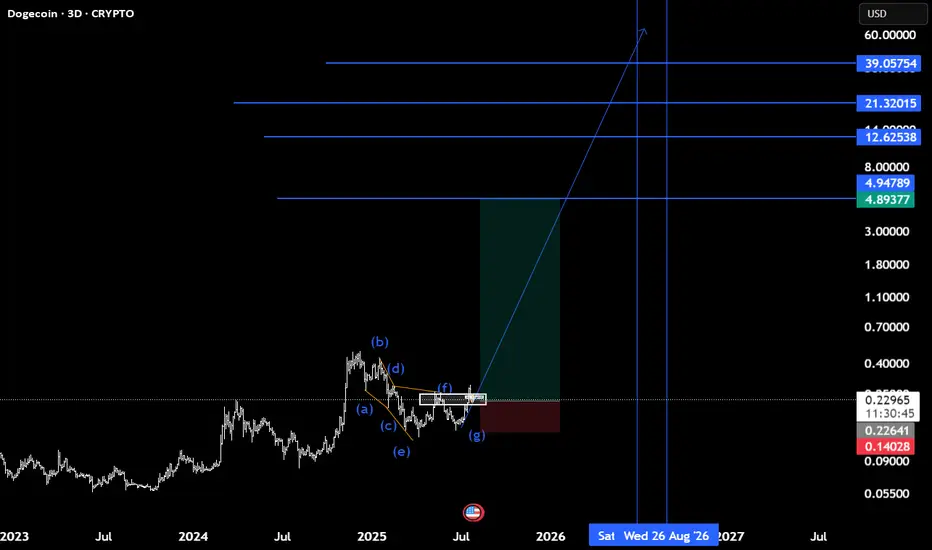
Doge(based on NEo wave)confirmation of finishing the E wave of triangle is here now.
it takes about 400 days for all targets to pass.
see the related last chart of doge.
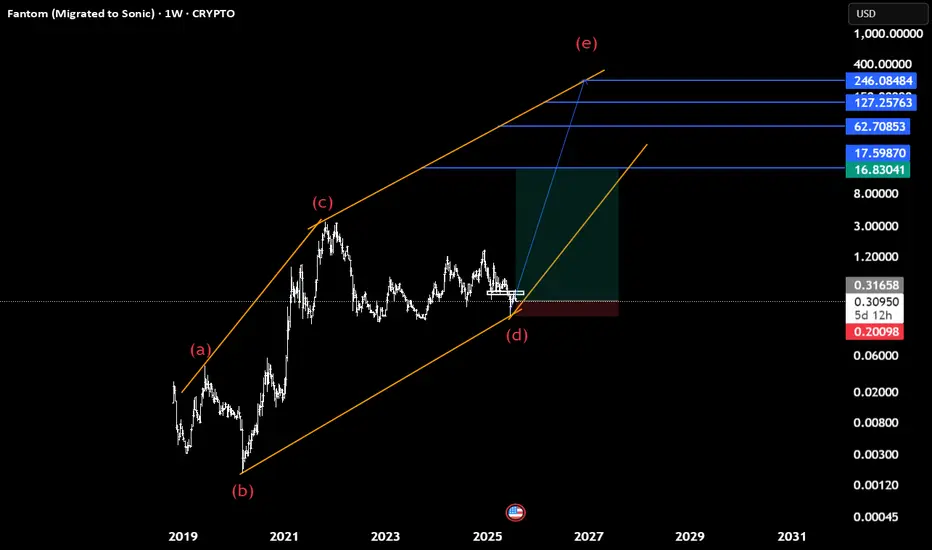
Sonic(based on NEo wave)Soon Sonic will start heavy bullish waves to the targets which shown with blue lines.
95% it is a diamnod diametric and we cant consider this as descending triangle because there is no overlap between wave d and a.
BTC(based on NEo wave)This range price is shown as a bow-tie diametrical.
I think G wave will end at one of those prices, 113 or 116
after this it will start a good bullish wave.
stop loss is 110K and the first target is 138K.
BITCOIN =140-150kThe X-wave has formed in the form of a neutral triangle pattern, and eventually Bitcoin could once again touch $106,000 and move towards $140,000-150,000 with the completion of wave-e.
Good luck
NEoWave Chart

Saham PTBA: Tunggu Sinyal lenkap dgn 5 Peluru📊 Stock Analysis of PTBA Bukit Asam Tbk. using Profitmore Trade™'s 5 Bullets Strategy:
🔹 1. Zero Line
🔹 2. AO Divergence
🔹 3. SQUAT
🔹 4. Fractal
🔹 5. Momentum
🔍 Market Segmentation Analysis:
📅 Monthly: Even segment
📅 Weekly: 8 even segments (Monthly timeframe)
📅 Daily: Corrective even segment (2 waves) after a bearish odd segment
⚠️ Not Yet Time to Enter! The 5 Bullets signals are not yet complete. Wait ~2 weeks for confirmation of optimal entry conditions.
📌 Odd & Even Segment Theory: Even segments typically last as long as or longer than odd segments. Monitor the market closely!
#ProfitmoreTrade #StockAnalysis #PTBA #TradingView #TechnicalAnalysis #IndonesianStocks

BTC.D(based one NEowave)the Z wave of this branch shown as a triangle and I think its finished but for confirmation breaking the 61.9 is important.
its a green light of Altseason.

ADA(based on NEowave)this branch of Cardano is diamond diametrical but I didnt count the other branches and the larger degrees but based on ETH and other Altcoins I think it will pump soon.

Doge(based on NEowave)like ETH wave E is ending and soon it will start a huge bullish wave.
wave E look likes a bow-tie diametrical and wave g is at the end which is the last chance to buy.

USDT.D(based on NEowave)I think wave E of triangle touched the necessary high and crypto is ready for a big pump.
pay attention to the targets and stop loss!

Get ready for a 20-25% price drop
The bearish scenario for the BIST 100 index remains valid. It seems that the next downward wave will begin after the formation of the contracting triangle.
Good luck
NEoWave Chart

ETH(based on NEowave)I changed my analysis and I think Its better to consider eth in the middle of the running diamond diametrical.
stop loss of this analysis is 2400$.

Solana(based on NEowave)I consider this as a triangle but under the price zone which is 139 it tells us its going to make a diamond diametrical.

ETH(based on NEowave)now the E wave of that cycle triangle looks like also a triangle.(if you dont know what Im talking about check the last analysis of ETH)
if e wave of this triangle breaks the SL it turns to a diamond diametrical.

Will the Euro weaken against the US Dollar?EURUSD has started a price and time correction since July 28, 2008 in the form of a diametric pattern.
Wave-(f) currently appears to be forming. We see two price ranges for the end of wave-(f) in terms of price:
a - range 1.15758-1.17173
b - range 1.21357-1.23505
After the completion of wave-(f) we expect wave-(g) to continue to the specified range.
Good luck
NEoWave Chart

Has the Alt Season Started?Cash Data 1W
By analyzing the weekly Cash Data chart of TOTAL3, we observe that after a rapid and significant rise, a correction in TOTAL3 has begun, which appears to be forming a Neutral Triangle pattern.
Wave Analysis:
Wave-(c) is a double pattern with a small X-wave, making it the most complex wave. However, there is a possibility that wave-(d) could become more complex than wave-(c). We are currently in wave-(d). Given that wave-(b) has surpassed the start of wave-(a) and wave-(c) has been fully retraced by wave-(d), there is a likelihood that a Running Neutral Triangle is forming. For confirmation, wave-(d) must exceed the starting point of wave-(c).
Conclusion:
Based on the analysis, wave-(d) could rise to the range of 1.14–1.38 trillion USD. Subsequently, wave-(e) will begin and may conclude within the retracement zones identified on the chart. To accurately determine the target for wave-(e), we need wave-(d) to complete, allowing us to predict the end of the Running Neutral Triangle with greater precision.
After the completion of the Running Neutral Triangle, we expect a significant rally in altcoins.
Good luck
NEoWave Chart

GOLD correction continues to $3,150The recent corrective wave that started at $3500 is turning into a larger corrective pattern. We are currently in wave-(c) of this correction which is completing a diametric.
This diametric pattern could end in the $3200 or $3150 price range.
Good luck
NEoWave Chart

ETH(based on NEowave)Im sharing this because wave D is at the end and in the next 2 month you can see the main movement which is the start of wave E.
wave E takes about 350-450 days but after that there is a big and longtime bearish wave!

Will NIFTY50 fall?Regarding NIFTY 50 Index
my expectation was that after a small growth, the g-wave from the diametric will be completed, then the price correction will start and the reason for it can be anything, definitely if the correction starts, the reason will be the war between India and Pakistan.
Normal:
The correction can continue up to the range of 23209-23456 and after spending the required time, start moving up. If this range is broken, the correction can end in the range of 22300-22700.
Pessimistic:
If the end of the wave-(D) is broken strongly, the upward movement that was formed from 21740 to 24593 will be considered as an X-wave and the wave-(D) will turn into a double pattern. Although the upward movement that formed from 21740 to 24593 does not have all the conditions of the X-wave, but when the market is not normal, we need to be a little flexible in our analysis.
What will be the second pattern of the double combination?
Usually, after the diametrics, the second pattern tends to be a neutral triangle or a contracting triangle or a reverse contracting triangle. But I will not comment on it now and wait for a few waves of the second pattern to form, then we can predict the pattern with more probability.
Good luck
NEoWave Chart

A larger corrective pattern is formingIn the previous analysis, a specific range was determined for the price to reverse, after reaching that price range, the price jumped upwards and the price grew by 1700 pips. However, considering that the structure of wave-c is not an impulse, the zigzag was not confirmed and it seems that a larger corrective pattern is forming.
It seems that the reverse contracting triangle pattern is forming, which is currently in wave-d of the triangle. With the completion of wave-d, we can better find the end point of wave-e.

BTC.D(based on NEo wave)I changed my idea about midterm but not about longterm!
Altseason will make a heavy downtrend for this in a few months later which I call it wave E
