


Intraday Playbook ES Futures: Trade Setup & Context CME_MINI:ES1!
Big Picture Context
Please see related trade idea.
In this analysis, we refine our intraday levels to identify potential trade setups. We also review recent price action and present a high-probability long trade example that frequently offers favorable risk-reward dynamics when

/
The best trades require research, then commitment.
$0 forever, no credit card needed
Photo: Jimmy Chin ©
Where the world does markets
Join 100 million traders and investors taking the future into their own hands.

Disney Stock Pops on Strong Earnings Data. Turnaround Working?The Magic Kingdom just pulled a rabbit out of its hat — and Wall Street’s loving it.
Disney stock NYSE:DIS surged 11% on Wednesday, not just for its best day in a year, but for the kind of earnings beat that makes analysts reconsider their entire valuation model while retail traders tweet “ NYSE:

EURUSD Bearish Structure Forming Amid Dollar UncertaintyEURUSD appears to be carving out a series of lower highs, showing potential signs of distribution. With price compressing inside a symmetrical triangle following multiple failed breakout attempts, the stage could be set for a bearish breakdown. This comes as U.S. inflation and Fed policy hold the sp

BTC - Golden Pocket test & what comes next?Bitcoin (BTC) has been steadily recovering from its January correction, entering a promising uptrend that has now brought it to a crucial technical juncture: the Golden Pocket Fibonacci zone, which lies between the 61.8% and 65% retracement levels. This area is widely watched by traders, as it often

Market Insights with Gary Thomson: 5 - 9 MayMarket Insights with Gary Thomson: Fed and BoE Rate Decisions, Canada Jobs, Earnings Reports
In this video, we’ll explore the key economic events, market trends, and corporate news shaping the financial landscape. Get ready for expert insights into forex, commodities, and stocks to help you naviga

Arbitrum (ARB): Multiple Good Risk:Reward Ratio Trades | SidewayArbitrum caught our attention with a possible BOS forming on smaller timeframes and a good sideways channel forming, which eventually we are looking to be broken, where we might be taking a sweet long position with some good R:R.
More in-depth info is in the video—enjoy!
Swallow Academy

Break and retest setup on NFLX soon? OptionsMastery:
🔉Sound on!🔉
📣Make sure to watch fullscreen!📣
Thank you as always for watching my videos. I hope that you learned something very educational! Please feel free to like, share, and comment on this post. Remember only risk what you are willing to lose. Trading is very risky but it can c

US Stocks Pare Back All Tariff-Fueled Losses. Are We So Back?Remember “Liberation Day”? The one that felt more like Liquidation Day ? When markets tanked, tickers turned red, and you were afraid to check the markets on the next day? Well, turns out the rumors of the market’s demise were — once again — greatly exaggerated.
If the average recession 10 years a

BTC Building Strength – Breakout Ahead?$BTC/USDT Weekly Analysis
Bitcoin continues to respect the 50 EMA on the weekly timeframe — a key dynamic support level that has consistently held throughout this bullish structure.
Each time BTC corrected, it found support near the 50 EMA before bouncing back with strength. The current structure

WC: 27.48 Target: 1800-2400 MOASS: 47k-100K: GAMESTOP DECODEDThis video tells you EXACTLY what's happening with Gamestop and EXACTLY when PRICE will explode
AS FOR ME...I LOVE THE STOCK

See all editors' picks ideas
Best SMA FinderThis script, Best SMA Finder, is a tool designed to identify the most robust simple moving average (SMA) length for a given chart, based on historical backtest performance. It evaluates hundreds of SMA values (from 10 to 1000) and selects the one that provides the best balance between profitability,

Bitcoin Monthly Seasonality [Alpha Extract]The Bitcoin Monthly Seasonality indicator analyzes historical Bitcoin price performance across different months of the year, enabling traders to identify seasonal patterns and potential trading opportunities. This tool helps traders:
Visualize which months historically perform best and worst for

Market Manipulation Index (MMI)The Composite Manipulation Index (CMI) is a structural integrity tool that quantifies how chaotic or orderly current market conditions are, with the aim of detecting potentially manipulated or unstable environments. It blends two distinct mathematical models that assess price behavior in terms of bo

Dual-Phase Trend Regime Oscillator (Zeiierman)█ Overview
Trend Regime: Dual-Phase Oscillator (Zeiierman) is a volatility-sensitive trend classification tool that dynamically switches between two oscillators, one optimized for low volatility, the other for high volatility.
By analyzing standard deviation-based volatility states and applying

Nasan Risk Score & Postion Size Estimator** THE RISK SCORE AND POSITION SIZE WILL ONLY BE CALCUTAED ON DIALY TIMEFRAME NOT IN OTHER TIMEFRAMES.
The typically accepted generic rule for risk management is not to risk more than 1% - 2 % of the capital in any given trade. It has its own basis however it does not take into account the stocks

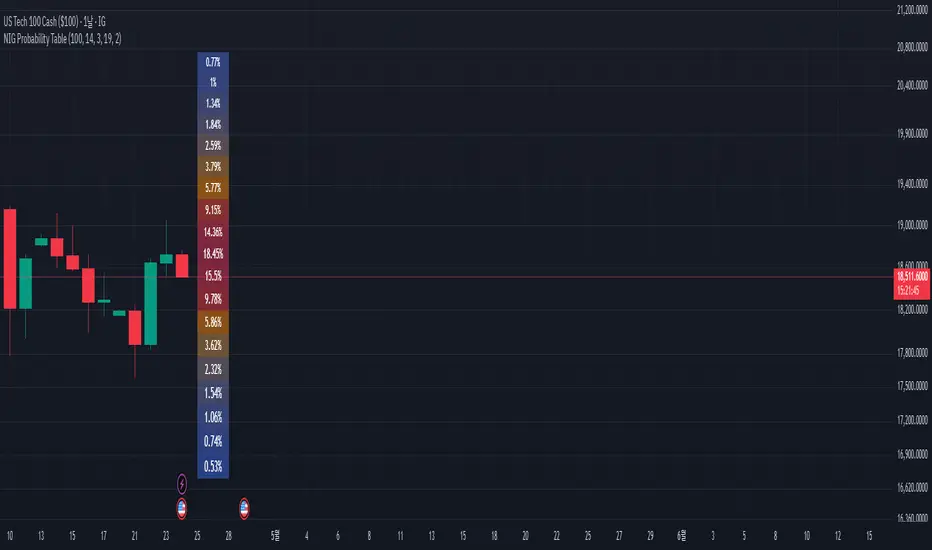
NIG Probability TableNormal-Inverse Gaussian Probability Table
This indicator implements the Normal-Inverse Gaussian (NIG) distribution to estimate the likelihood of future price based on recent market behavior.
📊 Key Features:
- Estimates the parameters (α: tail heaviness, β: skewness, δ: scale, μ: location)
of th
Log-Normal Price ForecastLog-Normal Price Forecast
This Pine Script creates a log-normal forecast model of future price movements on a TradingView chart, based on historical log returns. It plots expected price trajectories and bands representing different levels of statistical deviation.
Parameters
Model Length –

Market Sessions & Viewer Panel [By MUQWISHI]▋ INTRODUCTION :
The “Market Sessions & Viewer Panel” is a clean and intuitive visual indicator tool that highlights up to four trading sessions directly on the chart. Each session is fully customizable with its name, session time, and color. It also generates a panel that provides a quick-glance

Elastic Volume-Weighted Student-T TensionOverview
The Elastic Volume-Weighted Student-T Tension Bands indicator dynamically adapts to market conditions using an advanced statistical model based on the Student-T distribution. Unlike traditional Bollinger Bands or Keltner Channels, this indicator leverages elastic volume-weighted averaging

Dynamic RSI Regression Bands (Zeiierman)█ Overview
The Dynamic RSI Regression Bands (Zeiierman) is a regression channel tool that dynamically resets based on RSI overbought and oversold conditions. It adapts to trend shifts in real time, creating a highly responsive regression framework that visualizes market sentiment and directional

See all indicators and strategies
News didn't load
Looks like that didn't go very well. Let's try again.
Community trends
Disney Stock Pops on Strong Earnings Data. Turnaround Working?The Magic Kingdom just pulled a rabbit out of its hat — and Wall Street’s loving it.
Disney stock NYSE:DIS surged 11% on Wednesday, not just for its best day in a year, but for the kind of earnings beat that makes analysts reconsider their entire valuation model while retail traders tweet “ NYSE:
LEU watch $85.80 above 78.61 below: Wide Range looking to break LEU earnings report pumped to a minor Genesis fib at $85.80
If we get a fade of the pump then look for .618 retrace to $78.61
Next fib above is close so ideally a Dip entry gives better reward.

$OKTA is ready to RIP! 58% UpsideNASDAQ:OKTA was a big name I was talking about end of last year before we took a big dip in the markets...well we are back at the CupnHandle breakout level now and this trade looks ready to RIP!
Warning earnings on May 27th!
- Looking for a close on Friday above the breakout level for an entry he

NVIDIA (NVDA) – Inverse Head & Shoulders Breakout in PlayNASDAQ:NVDA NVIDIA (NVDA) – Inverse Head & Shoulders Breakout in Play
NVDA has broken above a key neckline at $108, confirming a classic inverse head & shoulders pattern. With the head at $85, the breakout projects a target around $138.
Trade Plan:
Entry: $117 (current level)
Stop Loss: $107 (be

$MSTR ONCE IN A LIFETIME MY BEST YETLong on the 618 Fibonacci at 236 this was one of my best plays this year
I am looking for some sort of pull back to potentially RE LOAD here for another huge leg into 420-500
Drop a LIKE if u played this one with me OR want the next setup LIVE lets do this!

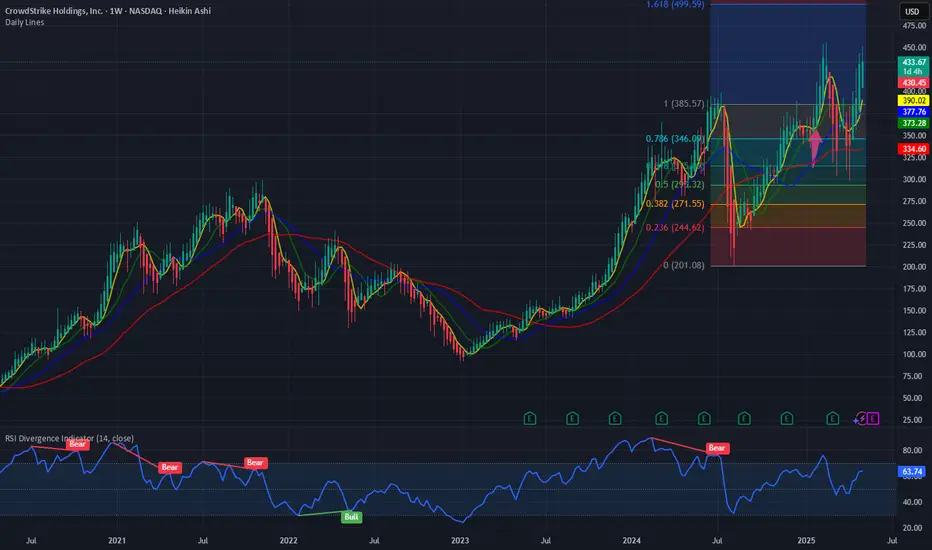
$CRWD : Exceptional performance. Next stop 500 $. Very few stocks can claim the performance and resiliency of Crowdstrike. NASDAQ:CRWD not only resisted the recent downturn in the volatile markets but also is above it previous multi cycle highs. The stock was @ 400 $ when the major global outage happened, and the stock touched the lows of 200 $ b
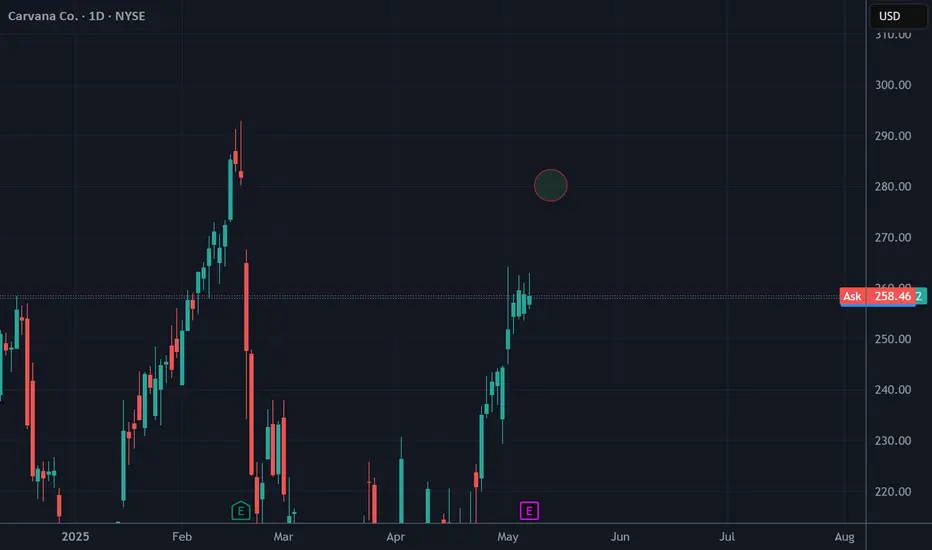
$CVNA - 260CallHi all,
My ai pinged me suggesting a 260 Call expiring around the 6'th of June on CVNA.
This model's performance is not terrible, but i;m not comfortable listening to my own AI which is suggesting to buy a call literally just before earnings. 2.6 Sharpe isn't bad but it's no 3.6 meaning it's not a
Electronic Arts: Jump!Recently, EA has made a strong upward jump, coming very close to the significant resistance at $169.82. However, the price quickly fell again, providing us with sufficient confirmation to consider the magenta wave (2) as completed. The current wave (3) should extend below the support at $114.60, and

Tesla - Don't get confused right here!Tesla - NASDAQ:TSLA - is about to create the bullish reversal:
(click chart above to see the in depth analysis👆🏻)
2025 has been a rough year for Tesla so far. With a drop of about -50%, Tesla is clearly breaking the average retail trader. But the underlying trend is still quite bullish and if p

"AMD at a Crossroad: Order Block Pressure vs Buyer Strength"
🔍 AMD Multi-Timeframe Trend Analysis – From 15m to Daily Confirmation
✅ 4H Timeframe – Bullish but Near Completion
On the 4-hour chart, AMD has shown a strong uptrend, with clear reaccumulation zones on both AO and RSI.
However, price is now approaching a Cloud Zone, suggesting the 4H stru

See all stocks ideas
Today
SNWVSANUWAVE Health, Inc.
Actual
—
Estimate
—
Today
ESNTEssent Group Ltd.
Actual
—
Estimate
1.65
USD
Today
EMBCEmbecta Corp.
Actual
—
Estimate
0.53
USD
Today
OBOutbrain Inc.
Actual
—
Estimate
−0.13
USD
Today
TXNMTXNM Energy, Inc.
Actual
—
Estimate
0.20
USD
Today
ANIPANI Pharmaceuticals, Inc.
Actual
—
Estimate
1.38
USD
Today
PLXProtalix BioTherapeutics, Inc. (DE)
Actual
—
Estimate
0.08
USD
Today
DIBS1stdibs.com, Inc.
Actual
—
Estimate
−0.13
USD
See more events
Community trends
BITCOIN Breaks Higher - Is $106K the Next Target?COINBASE:BTCUSD is trading within an ascending channel, signaling bullish momentum. The price has consistently respected the channel boundaries, forming higher highs and higher lows, which aligns with the continuation of the uptrend.
Recently, the price has broken out with strong momentum and may

BTC – One last pushmarket context and structure
This BTCUSDT 4-hour chart from BYBIT provides a broader perspective on BTC’s ongoing uptrend, emphasizing the role of fair value gaps in guiding price behavior. After a prolonged period of sideways action and consolidation, BTC initiates a sharp bullish impulse that bre

Bitcoin – Price Hits $100K, Will It Hold or Dive Into Demand?Bitcoin has officially reached the long-anticipated $100,000 mark, sweeping the psychological round number and clearing out a major pool of liquidity sitting just above it. This move came off the back of a sharp and impulsive leg, likely fueled by both spot demand and late-stage FOMO-driven breakout

Bitcoin Breaks Heavy Resistance Zone— But Can It Hold?Bitcoin ( BINANCE:BTCUSDT ) started to rise yesterday as the S&P 500 Index ( FOREXCOM:SPX500 ) opened and it seems like it can break the Heavy Resistance zone($95,950-$88,500 ) this time, but there are still concerns from a technical analysis , so please stay tuned for this analysis .
Bit
BITCOIN Monthly RSI Heatmap reveals ultimate Cycle Sell Zone!Bitcoin (BTCUSD) has resumed the long-term bullish trend and as of the writing of this analysis, it is about to test the $100k key psychological level. Now that the Bull Cycle is entering its final stage (most likely for the next 6 months at most), it is time to see potential exit levels as close to

ETH - Is $3,000 next?Today marked a significant milestone for Ethereum as it successfully rolled out its much-anticipated Pectra upgrade. The update, which introduces a number of technical enhancements aimed at improving scalability, security, and developer experience, has already had a noticeable impact on market senti

Bitcoin - LifeTime Opportunity! Satoshi = AliensThis is probably the last time we see Bitcoin above 94,000 USDT! In the next months we can expect prices below 70k and 60k. Why? It's because of a huge bear market that started in February 2025 with Donald Trump's election.
Crypto technology is not new. It was brought to planet Earth from outside.

BTC Maintains Strategic Bullish Structure New ATH Still insightHello Traders and Crypto Enthusiasts! 👋
I'm excited to share a detailed analysis of Bitcoin (BTC) on its ongoing bullish structure, maintaining higher highs and higher lows. This chart captures the key support zones, demand areas, and chart patterns that underpin our optimistic outlook. Let’s dive

Bitcoin @$100,000 | Top Altcoins Choice —Your Pick (Session 6)Good morning my fellow Cryptocurrency trader, what a wonderful day.
Bitcoin is now on its fifth consecutive green week and challenging $100,000 as resistance today.
The last barrier was a price range between $94,000 and $98,000. This barrier is now gone. Bitcoin continues to move higher day by day

VET - Garbage (For This Cycle) Until Proven Otherwise20 minute technical work-through.
VET has a terrible chart and may be one of quite a few coins to be printing a multi cycle bear market..
This means that anyone holding VET this cycle or even from previous cycle may see their positions erode significantly or even lose everything.
Just to be clear

See all crypto ideas
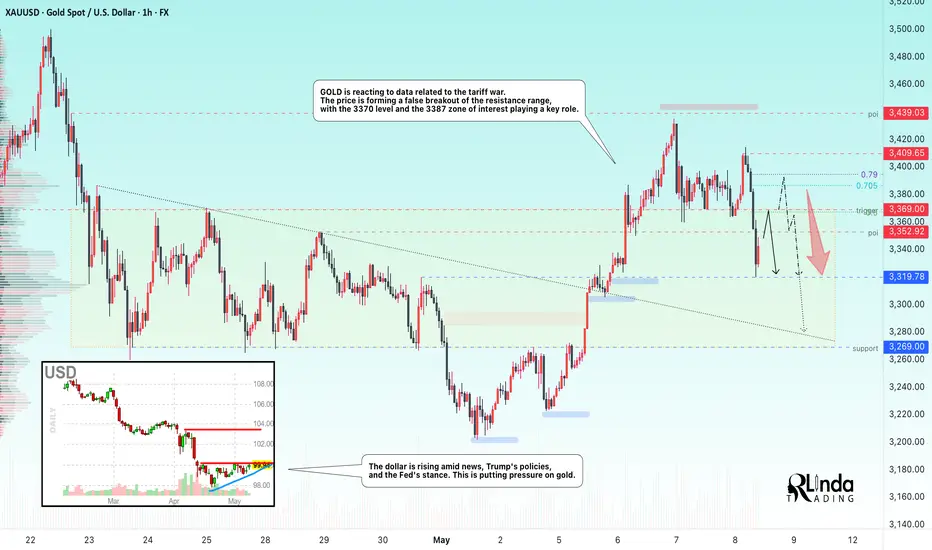
GOLD → Return to range. Fall from resistance...FX:XAUUSD is reacting to data related to the tariff war. The price is returning to the range and forming a false breakout of resistance. The level of 3370 and the zone of interest at 3387 play a key role.
On Thursday, gold rose to $3,400 amid a weaker dollar, increased demand for safe-haven as
Lingrid | GOLD potential PULLBACK and CONTINUATIONThe price perfectly fulfilled my previous idea . OANDA:XAUUSD is accelerating off the trendline support with a sharp impulse leg and now hovering around a potential breakout zone. Momentum remains bullish as price reclaims previous highs and aims for the upper boundary of the resistance zone. The

GOLD Analysis - Can buyers push toward 3,410$?OANDA:XAUUSD is trading within a clear ascending channel, with price action consistently respecting both the upper and lower boundaries. The recent bullish momentum indicates that buyers are in control, suggesting there's chances for potential continuation on the upside.
The price has recently bro

XAU/USD - Fed warns of Economic UncertaintyThe XAU/USD pair on the M30 timeframe presents a Potential Buying Opportunity due to a recent Formation of a Bullish Flag Pattern. This suggests a shift in momentum towards the upside and a higher likelihood of further advances in the coming hours.
Possible Long Trade:
Entry: Consider Entering A

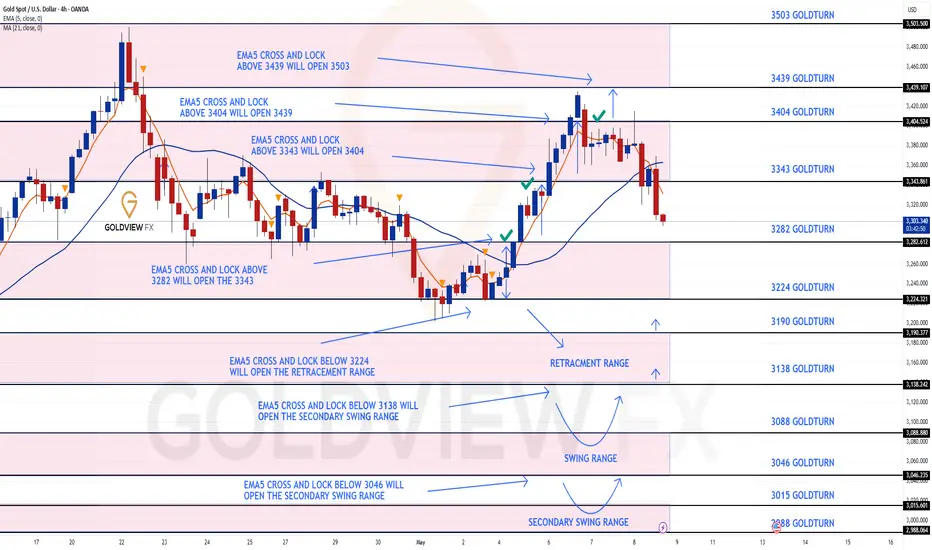
GOLD 4H CHART ROUTE MAP UPDATEHey Everyone,
Once again another smashing day on the charts today. After sharing updates and completing targets on our 1h chart idea; please now see update on our 4H chart idea, which is also playing out as analysed.
We started with our Bullish target hit at 3282, followed with ema5 cross and lock
(XAU/USD) Bearish Trade Setup – Targeting $3,222 with 1:6 Risk/REntry Point: Around 3,409.33 - 3,408.41 USD.
Stop Loss: 3,437.87 USD.
Target (Take Profit): 3,222.53 USD.
Risk/Reward Ratio: Approximately 1:6, which is favorable.
📉 Price Action & Trend Analysis:
A rising wedge (or channel) appears to have formed and broken to the downside — a bearish signal.

XAU/USD: Gold Regains Strength After Pullback – New Highs Ahead?By analyzing the gold chart on the 2-hour timeframe, we can see that yesterday, as expected, gold surged above $3400, reaching as high as $3439 before facing strong selling pressure, dropping sharply to $3359.
Currently, gold is trading around $3385, and if the price can hold above $3366, we may ex

THE KOG REPORT - Update End of day update from us here at KOG:
We can honestly say, even though the KOG Report plan didn't work out as we intended this week, it's been a phenomenal week on gold in Camelot. We've managed to capture the top (AGAIN), then bounced the low, then produced the FOMC KOG Report which gave us anot

08.05.25 Morning ForecastPairs on Watch -
FX:AUDCAD
FX:EURCAD
FX:USDCHF
FOREXCOM:COFFEE
A short overview of the instruments I am looking at for today, multi-timeframe analysis down to what I will be looking at for an entry. Enjoy!

Gold's Bearish Momentum Builds from PRZ-Short SetupGold ( OANDA:XAUUSD ) started to decline exactly from PRZ (previous idea) as I expected in my previous idea . And with the loss of the Support zone($3,387-$3,357) we can expect further decline.
Gold is currently moving near the Resistance zone($3,387-$3,357 ) and the Potential Reversal Zon

See all futures ideas
EURUSD Bearish Structure Forming Amid Dollar UncertaintyEURUSD appears to be carving out a series of lower highs, showing potential signs of distribution. With price compressing inside a symmetrical triangle following multiple failed breakout attempts, the stage could be set for a bearish breakdown. This comes as U.S. inflation and Fed policy hold the sp
GBPCHF in consolidation before fallingThe currency pair is approaching the range resistance. Today is the news from FOMC, a false breakout and a fall is possible, as the dollar is expected to rise, which in turn may negatively affect the pair
Scenario: There is a possibility that the resistance may hold if the Fed becomes more hawkis

GBPJPY BULLISH OR BEARISH DETAILED ANALYSISGBPJPY is currently trading near 192.100 and has successfully broken out of a falling wedge pattern on the 12-hour chart. This classic bullish reversal structure indicates that buyers have regained control, with momentum building for a potential move toward the 197.400 target area. The breakout cand

USDJPYHello Traders! 👋
What are your thoughts on USDJPY?
On the USD/JPY chart, we observe a breakdown of the ascending channel, which could signal a potential trend reversal and growing bearish momentum.
Currently, the price is pulling back to the broken level.
Given the overall bearish structure, we ex


AUDCHF - Potential SellHi traders,
Here is my view on the AUDCHF trade coming this week to next week.
BIAS: BEAR
Logical Analysis: Price has declined fast and strong from ~0.5607 to ~0.5113.
The Store has so much CMCMARKETS:AUDCHF in stock that no one has been in to buy at around 0.5600-0.5350.
From the 9th A

EURUSD Analysis Today: Technical and Order Flow !In this video I will be sharing my EURUSD analysis today, by providing my complete technical and order flow analysis, so you can watch it to possibly improve your forex trading skillset. The video is structured in 3 parts, first I will be performing my complete technical analysis, then I will be mov

Bullish bounce?The Swissie (USD/CHF is reacting off the pivot and could potentially rise to the 1st resistance that aligns with the 38.2% Fibonacci retracement.
Pivot: 0.8213
1st Support: 0.8116
1st Resistance: 0.8357
Risk Warning:
Trading Forex and CFDs carries a high level of risk to your capital and you sho

MarketBreakdown | EURUSD, USDCAD, NZDUSD, USDCHF
Here are the updates & outlook for multiple instruments in my watch list.
1️⃣ #EURUSD daily time frame 🇪🇺🇺🇸
EURUSD formed a huge head and shoulders pattern.
The price is currently testing its horizontal neckline.
Bearish breakout of that and a daily candle close below
will confirm a bearish rev

See all forex ideas
| EUR | USD | GBP | JPY | CHF | AUD | CAD | ||
|---|---|---|---|---|---|---|---|---|
| EUR | - | - | - | - | - | - | - | |
| USD | - | - | - | - | - | - | - | |
| GBP | - | - | - | - | - | - | - | |
| JPY | - | - | - | - | - | - | - | |
| CHF | - | - | - | - | - | - | - | |
| AUD | - | - | - | - | - | - | - | |
| CNY | - | - | - | - | - | - | - | |
| CAD | - | - | - | - | - | - | - |
Trade directly on the supercharts through our supported, fully-verified and user-reviewed brokers.


