Stocks Are Crushing It at Record Highs. What’s Behind the Rally?Happy record highs, everyone — confetti, champagne, and yet another all-time high. The Nasdaq NASDAQ:IXIC and the S&P 500 SP:SPX just did it again — notched fresh closing records that have traders flexing their P&Ls like it’s 1999.
If you’ve been on the sidelines, you’re probably staring at th
About S&P 500 Index
Standard and Poor's 500 Index is a capitalization-weighted stock market index measuring the performance of 500 large publicly traded companies in the United States. This index covers a wide range of industries, including technology, healthcare, energy, and finance. It serves as a benchmark for the overall health of the U.S. stock market, as well as a reflection of the country's economic strength.
Substantial gains in the S&P 500 are often interpreted as positive signals for the economy, while losses can be seen as indicators of potential trouble. Investors use this index as a barometer for their own portfolios and to assess the performance of individual stocks. The S&P 500 index plays a vital role in the financial world and is closely watched by analysts and policymakers.
Substantial gains in the S&P 500 are often interpreted as positive signals for the economy, while losses can be seen as indicators of potential trouble. Investors use this index as a barometer for their own portfolios and to assess the performance of individual stocks. The S&P 500 index plays a vital role in the financial world and is closely watched by analysts and policymakers.
Related indices

Hellena | SPX500 (4H): LONG resistance area of 6176 (Wave 1).Colleagues, the previous forecast remains essentially unchanged, and the target is still 6176, but I think the forecast can be updated because the price has been flat for quite some time.
I still expect the upward movement to continue in the large wave “1” and in the medium-order wave “5”.
A small
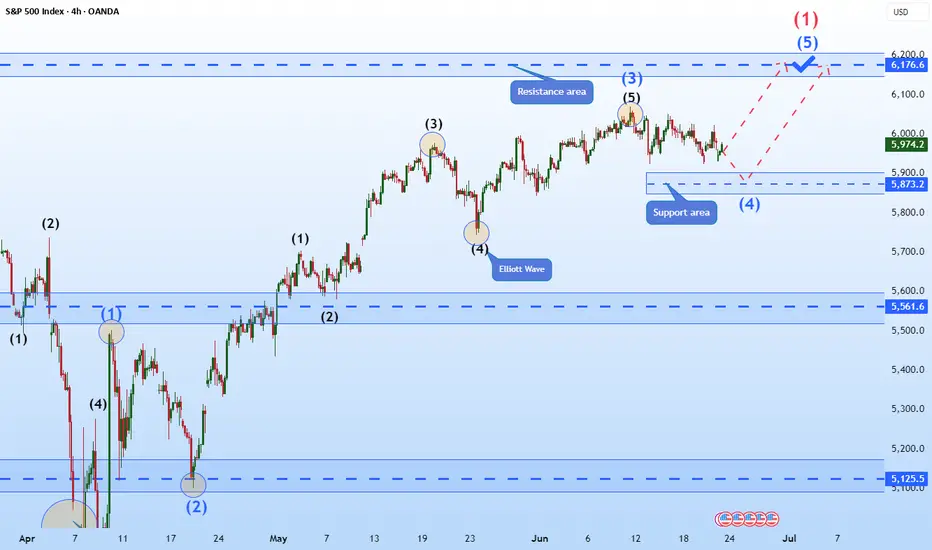
S&P500 Potential UpsidesHey Traders, in today's trading session we are monitoring US500 for a buying opportunity around 6,075 zone, S&P500 is trading in an uptrend and currently is in a correction phase in which it is approaching the trend at 6,075 support and resistance area.
Trade safe, Joe.

Nasdaq All-Time Highs, S&P Close, Blast Off or Breakdown?What an incredible melt-up since April 7 lows in the US markets.
Trump vs Musk - ignored
Iran vs Israel - ignored
High Valuations - ignored
FED Pausing - ignored
The US economy is resilient and it's a good thing because the world is performing really well (EX-US). Europe/China/India/Emerging Marke

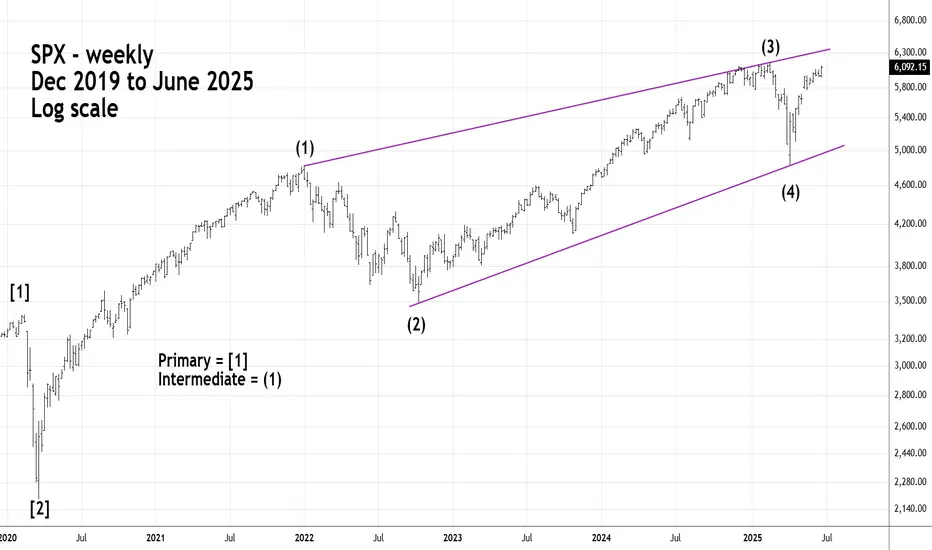
Long - Term S&P 500 - Elliott Imulse WaveThe S&P 500 - (SPX) could soon complete a five - year Elliott Impulse wave that began in March 2020.
Fibonacci resistance is in the SPX 6,200 area which could be reached on 06/26/25 or 06/27/25.
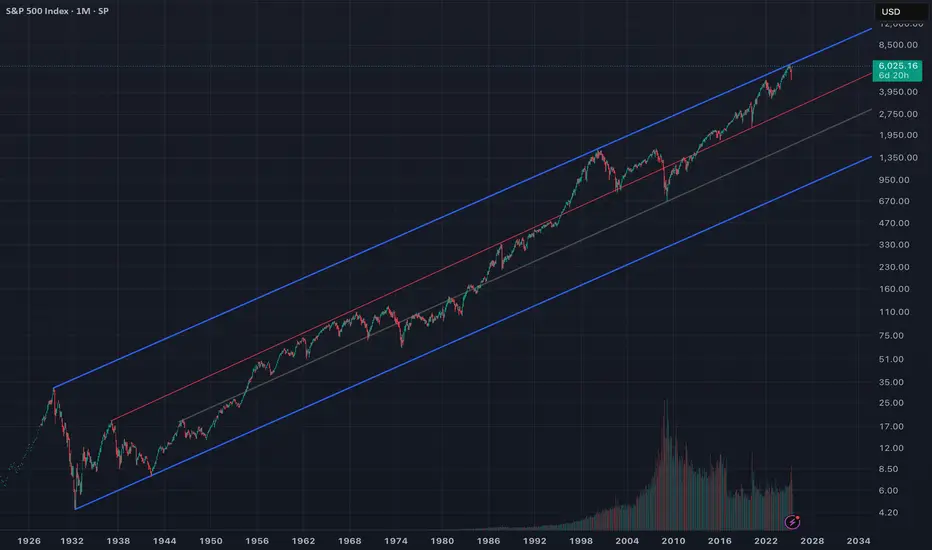
S&P500 1D Golden Cross, middle of 3y Channel, much upside to go!The S&P500 index (SPX) has been trading within a Channel Up since the final sell-off of the 2022 Inflation Crisis. The only time this pattern broke was for 4 days during the bottom formation (April 2025) of the recent Trade War.
Ahead of the first 1D Golden Cross since January 26 2023, the market l

S&P500 and Nasdaq Short: Wave 5 <= Wave 3Based on the Elliott Wave rule that wave 3 is not the shortest wave, I gave a projection on where the peak of both S&P500 and Nasdaq could be. Based on these peaks, the stop is set above and the take profit target is where wave 4 was.

🇺🇸 America at the Crossroads: Golden Age or Great Reset? As the S&P 500 crosses 6,000 , investors celebrate yet another all-time high. But beneath the surface of this rally lies an uncomfortable truth: we are standing at a national and market inflection point.
This isn’t just another leg up. This is the top of a century-long trend channel, a moment wh
S&P 500 Futures Rise on Ceasefire Relief, Eyes on Fed PowellSPX500 OVERVIEW
U.S. Futures Rise as Ceasefire Eases Tensions, Focus Turns to Powell
U.S. stock futures climbed on Tuesday, with S&P 500 futures up 0.8%, extending gains from the previous session as Middle East tensions eased following a ceasefire announcement.
President Trump confirmed a ceasefi

S&P 500 - Fibonacci Resistance Intermediate wave (5) up from the 04/07/25 bottom could be nearing completion.
Minor wave 5 of (5) is close to a Fibonacci relationship with Minor wave 1.
Using leeway around the 6,208 target gives a broad zone of 6,175 to 6,220. The SPX could reach this zone on 06/27/25.

See all ideas
Summarizing what the indicators are suggesting.
Oscillators
Neutral
SellBuy
Strong sellStrong buy
Strong sellSellNeutralBuyStrong buy
Oscillators
Neutral
SellBuy
Strong sellStrong buy
Strong sellSellNeutralBuyStrong buy
Summary
Neutral
SellBuy
Strong sellStrong buy
Strong sellSellNeutralBuyStrong buy
Summary
Neutral
SellBuy
Strong sellStrong buy
Strong sellSellNeutralBuyStrong buy
Summary
Neutral
SellBuy
Strong sellStrong buy
Strong sellSellNeutralBuyStrong buy
Moving Averages
Neutral
SellBuy
Strong sellStrong buy
Strong sellSellNeutralBuyStrong buy
Moving Averages
Neutral
SellBuy
Strong sellStrong buy
Strong sellSellNeutralBuyStrong buy
Displays a symbol's price movements over previous years to identify recurring trends.
Frequently Asked Questions
The current value of S&P 500 Index is 6,204.94 USD — it has risen by 0.52% in the past 24 hours. Track the index more closely on the S&P 500 Index chart.
S&P 500 Index reached its highest quote on Jun 27, 2025 — 6,187.68 USD. See more data on the S&P 500 Index chart.
The lowest ever quote of S&P 500 Index is 2.73 USD. It was reached on Jun 1, 1877. See more data on the S&P 500 Index chart.
S&P 500 Index value has increased by 3.94% in the past week, since last month it has shown a 5.10% increase, and over the year it's increased by 13.05%. Keep track of all changes on the S&P 500 Index chart.
The top companies of S&P 500 Index are NASDAQ:NVDA, NASDAQ:MSFT, and NASDAQ:AAPL — they can boast market cap of 3.85 T USD, 3.70 T USD, and 3.06 T USD accordingly.
The highest-priced instruments on S&P 500 Index are NYSE:NVR, NASDAQ:BKNG, and NYSE:AZO — they'll cost you 7,385.66 USD, 5,789.24 USD, and 3,712.23 USD accordingly.
The champion of S&P 500 Index is NASDAQ:PLTR — it's gained 439.24% over the year.
The weakest component of S&P 500 Index is NASDAQ:MRNA — it's lost −77.49% over the year.
S&P 500 Index is just a number that lets you track performance of the instruments comprising the index, so you can't invest in it directly. But you can buy S&P 500 Index futures or funds or invest in its components.
The S&P 500 Index is comprised of 503 instruments including NASDAQ:NVDA, NASDAQ:MSFT, NASDAQ:AAPL and others. See the full list of S&P 500 Index components to find more opportunities.