Nestle India in BreakoutNSE:NESTLEIND shows a breakout of a bullish ascending traingle trend. You can enter at 2460 and Target for 2640.
Nestleanalysis
$Nestle PLC over 40% retracement in a Falling WedgeNestlé Nigeria Plc is a leading food and beverage company in Nigeria, manufacturing and marketing a variety of products under renowned brands such as Maggi, Milo, Nescafé, and Golden Morn.
MYX:NESTLE all time high is about 1600 Naira/share
Current price: 975 Naira/share - A 40% discount from all time high.
In the past, after #nestle price action broke out its falling wedge, it made over a 100% move upwards. IF HISTORY REPEATS, Nestle stands a chance to reclaim these resistances: 1026, 1253, 1553 and even higher.
This idea invalidates under 793.

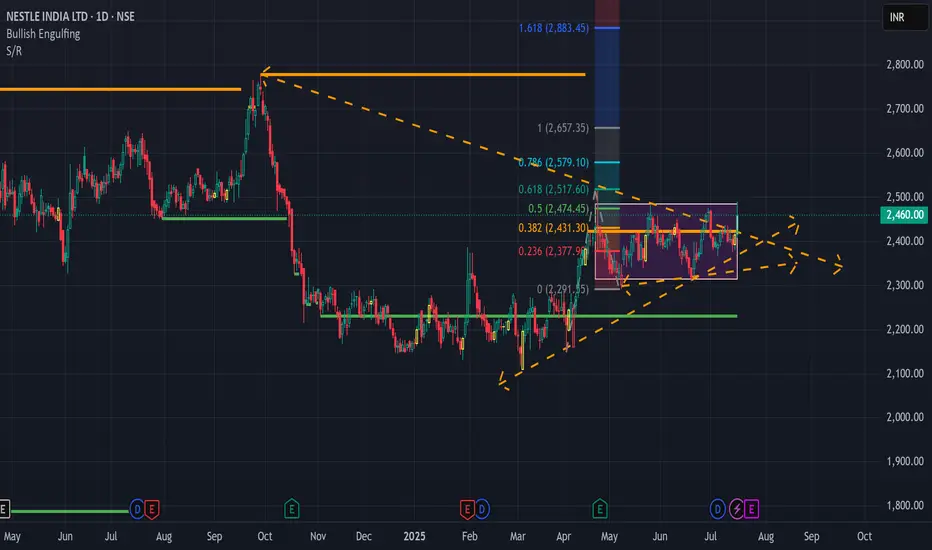
NESTLE INDIA If the price bounces from this support, the next resistance level could be around 2,450–2,500.
If the price breaks this support, it would be a bearish breakdown, and the price could fall to 2,250 or even lower.
If you find this helpful and want more FREE forecasts in TradingView, Hit the 'BOOST' button
Drop some feedback in the comments below! (e.g., What did you find most useful?
How can we improve?)
Your support is appreciated!
Now, it's your turn!
Be sure to leave a comment; let us know how you see this opportunity and forecast.
Have a successful week
DISCLAIMER: I am NOT a SEBI registered advisor or a financial adviser. All the views are for educational purpose only

NESTLEINDIA - Butterfly PatternThere is a probability of a butterfly pattern on the daily chart of NestleIndia.
Sustaining 18100, the stock might move towards 19200- 19400 in the coming sessions initially and then towards 20300-20350 levels.

''NESN'' Time to Sellwe wait for the range break and after the confirmation we can take the sell position

NESTLEIND Company website- www.nestle.in
Product Verticals ---> Beverages, cereals, chocolates, dairy, nutrition, foods, vending machines
Famous brands- Nescafe coffee, Maggi noodles, Milkybar chocolate, Milo, Kit Kat chocolate, Bar-One, Milkmaid, Cerelac baby food, Boost health drink ( bet you have heard of them )
4% market share, plenty of upside for such a MNC.
Financials- low debt, ascending PAT (12% yoy ), 0 pledged shares, high dividend yield at 180%
__________________________________________________________________________________________________________________________
PRO TIP : 4 stocks in your portfolio and you own 99% FMCG market in india- ITC, HUL, NESTLE AND BRITANNIA
Buy them all if you can :)
PS: I have the money, vested interest is being invested in all these companies, for the effort of writing this, be a good dude and give it a like a share or buy me a beer :)
STEP UP YOUR GAME! Get Rich!

Nestle IndiaThis Big FMCG stock forming symmetric triangle on 30 MTF. Keep eye on this. Plan your trade accordingly...

NESTLE BREAKOUT! POTENTIAL 5% UPSIDEHello guys, So I have found a trade of the FMCG sector-NESTLE, it's consolidating in a symmetrical triangle pattern and looks ready to give the breakout for upside movement.
All the required info is in the chart above, take a look.
BUY ABOVE-19490
Targets mentioned in the chart above (white lines)
RSI has room for BULLS.
MACD turning BULLISH
Please LIKE, COMMENT and SHARE to motivate and support me. I'll keep on posting new ideas on Indices & Stocks. Be sure to follow so that you don't miss any good trades that might have been rewarding.
Any comments and critiques will be appreciated even if it's of opposite view as a trader can also be right so many times.

Buy Nestle India Target 🎯 22000Buy Nestle India Target 🎯 22000 because it's recently given major breakout

NESTLE -BEEP BEEP BEEP BEEPNestle - The Breakdown, finally happened, I was waiting for this move from past many sessions.
REfer the previous post (linked here ) for detailed analysis

NESTLE - time to maximize the tradeNESTLE - time to maximize the trade, its the area , i was expecting the stock would test , before falling further.
For Detailed analysis , please refer earlier post, linked in the post.

Nestle pushing itself to a consolidation zoneIf it fails to sustain 6596.15 then it'll head towards 16011.15

NESTLE formed Descending Triangle PatternNestle has been trading in a range since April 2020.
In technical terms, this particular range formation is called descending triangle, this patterns generally forms in downtrend and acts as continuation pattern, but in this case the structure of the stock is of uptrend, this bearish pattern may act as reversal pattern, because it indicates distribution , so i need to be cautious, before creating any long positions in this stock.
Length of this pattern if of approx 4 months.
Steps to identify and trade the Descending Triangle pattern.
1. Look for Previous Trend.
2. Upper trend line should be sloping downwards -
Two touch points are required to draw a trend line.
Each successive high should be lower than the previous one,
If the successive high is higher than the previous one, pattern would be invalid.
There should be some distance between the two highs.
3. Lower trendline should be horizontal -
Two touch points are required to draw a horizontal line.
Lows do not have to be exact, however it should be with reasonable proximity.
There should be some distance between the two lows.
4. Volume
Volume contracts during triangle formation.
Volume expand during breakdown.
Volume does not always gives confirmation.
5. Pullback
Sometimes prices pullback after breakdown, but not always and when price pullbacks, same triangle support would then act as resistance.
6. Target
Calculate the widest distance of the triangle and replicate it to the breakout point to find the target of the pattern.
7. Length of this pattern
It Varies from several weeks to few months, average being 1-3 months.

Nestle India - DowntrendNSE:NESTLEIND is currently in downtrend, sell on rise is advisable till it comes out of that channel with a bullish close.
