NESTLEIND
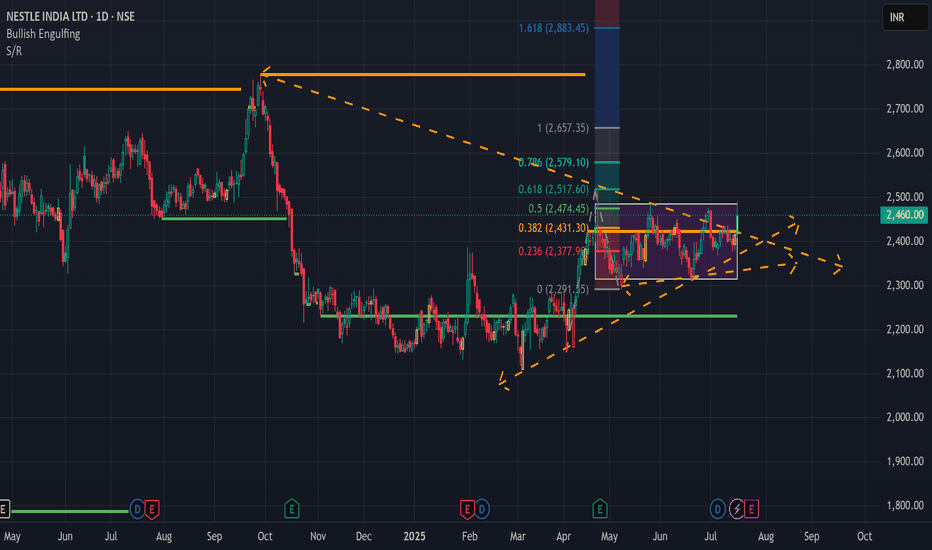
NESTLEIND buying opportunityPrice is showing a positive reaction from the institutional buying zone, suggesting a potential buying opportunity at the levels indicated in the chart.
NESTLEIND presents a strong opportunity for both short-term and long-term gains.
Please note: I am NOT a SEBI-registered advisor or financial advisor. The investment or trade ideas I share are solely my personal viewpoint and should not be considered as financial advice.
#XAUUSDFed exposed: Probability of raising interest rates next year up to 40%?
🔻 The Fed reduced interest rates by 0.25% to 4.25%-4.50%, but the market perceived this as a "hawkish" move.
🔻 The market reacted strongly: USD soared, stocks fell sharply, US bond yields increased.
🔻 The Fed's economic forecast is controversial when it increases the 2025 inflation forecast to 2.5% and reduces the number of interest rate cuts in 2024 to two.
🔻 Some economists, like Apollo Global Management's Torsten Slok, predict a 40% probability of the Fed raising interest rates by 2025.
🔻 The upcoming Trump administration's trade and tax policies could push inflation higher, forcing the Fed to consider raising interest rates sooner, possibly as soon as the second quarter of 2025.
🔻 Chairman Powell did not rule out the possibility of raising interest rates, emphasizing the need to maintain a flexible stance in the face of
MACD Crossover Swing Trade📊 Script: NESTLEIND
📊 Nifty50 Stock: YES
📊 Sector: FMCG
📊 Industry: Food - Processing - MNC
⏱️ C.M.P 📑💰- 2622
🟢 Target 🎯🏆 - 2769
⚠️ Stoploss ☠️🚫 - 2560
📊 Script: ADANIPORTS
📊 Nifty50 Stock: YES
📊 Sector: Marine Port & Services
📊 Industry: Miscellaneous
⏱️ C.M.P 📑💰- 1341
🟢 Target 🎯🏆 - 1426
⚠️ Stoploss ☠️🚫 - 1293
📊 Script: HEROMOTOCO
📊 Nifty50 Stock: YES
📊 Sector: Automobile
📊 Industry: Automobiles - Motorcycles / Mopeds
⏱️ C.M.P 📑💰- 4722
🟢 Target 🎯🏆 - 4949
⚠️ Stoploss ☠️🚫 - 4597
📊 Script: AMBUJACEM
📊 Nifty50 Stock: NO
📊 Sector: Cement
📊 Industry: Cement - North India
⏱️ C.M.P 📑💰- 612
🟢 Target 🎯🏆 - 650
⚠️ Stoploss ☠️🚫 - 592
📊 Script: BERGEPAINT
📊 Nifty50 Stock: NO
📊 Sector: Paints/Varnish
📊 Industry: Paints / Varnishes
⏱️ C.M.P 📑💰- 573
🟢 Target 🎯🏆 - 603
⚠️ Stoploss ☠️🚫 - 558
⚠️ Important: Always maintain your Risk & Reward Ratio.
✅Like and follow to never miss a new idea!✅
Disclaimer: I am not SEBI Registered Advisor. My posts are purely for training and educational purposes.
Eat🍜 Sleep😴 TradingView📈 Repeat 🔁
Happy learning with trading. Cheers!🥂
#BRITANNIA 4532 invest for Diwali recommend BUY- Rachit Sethia BRITANNIA 4532
TGT 5100 +++
SL 4400
TIMEFRAME <6M
RR > 3
Return >15% +++
Factors: BULLISH WEDGE BREAKOUT Trend Following Rising Volume with rising Prices. Flag pattern breakout. Pennant Pattern Breakout with Bullish Candle. Retest Successful. Higher Highs & Higher Lows. Broken above RESISTANCE levels Trading at SUPPORT levels Earnings are strong. Bullish Wedge Breakout Risk Return Ratio is healthy. And Rising from Double Bottom Pattern to Flag Pattern forming. If you like my work KINDLY LIKE SHARE & FOLLOW this page for free Stock Recommendations. With 💚 from Rachit Sethia
#Emamiltd #HINDUNILVR #ITC #DABUR #BRITANNIA #MARICO #NESTLEIND NSE: EMAMILTD
CMP: 486.35
Target 596 ~23%
Stop Loss: 450 Trailing
RR > 3
Tf 6M.
NSE:EMAMILTD
Factors:
BULLISH WEDGE BREAKOUT
Trend Following
Rising Volume with rising Prices.
Flag pattern breakout.
Pennant Pattern Breakout with Bullish Candle.
Retest Successful.
Higher Highs & Higher Lows.
Broken above RESISTANCE levels
Trading at SUPPORT levels
Earnings are strong.
Bullish Wedge Breakout
Risk Return Ratio is healthy.
And
Rising from Double Bottom Pattern to Flag Pattern forming.
If you like my work KINDLY LIKE SHARE & FOLLOW this page for free Stock Recommendations.
With 💚 from Rachit Sethia
NESTLE formed Descending Triangle PatternNestle has been trading in a range since April 2020.
In technical terms, this particular range formation is called descending triangle, this patterns generally forms in downtrend and acts as continuation pattern, but in this case the structure of the stock is of uptrend, this bearish pattern may act as reversal pattern, because it indicates distribution , so i need to be cautious, before creating any long positions in this stock.
Length of this pattern if of approx 4 months.
Steps to identify and trade the Descending Triangle pattern.
1. Look for Previous Trend.
2. Upper trend line should be sloping downwards -
Two touch points are required to draw a trend line.
Each successive high should be lower than the previous one,
If the successive high is higher than the previous one, pattern would be invalid.
There should be some distance between the two highs.
3. Lower trendline should be horizontal -
Two touch points are required to draw a horizontal line.
Lows do not have to be exact, however it should be with reasonable proximity.
There should be some distance between the two lows.
4. Volume
Volume contracts during triangle formation.
Volume expand during breakdown.
Volume does not always gives confirmation.
5. Pullback
Sometimes prices pullback after breakdown, but not always and when price pullbacks, same triangle support would then act as resistance.
6. Target
Calculate the widest distance of the triangle and replicate it to the breakout point to find the target of the pattern.
7. Length of this pattern
It Varies from several weeks to few months, average being 1-3 months.


