Netflix is going for $165This impulse from above, into this ascending channel is making me believe the price will move out impulsive from it as it often does, to the downside. And the price target is at $165 area which is where the ascending channel started.
Netflix

Netflix Simple Chart AnalysisNetflix - Most of the US tech counter out there, this chart still solid for the time being. If US Nasdaq trigger its rebound, this might follow to try for a 2nd attempt resistance 332 area.

NFLXNot financial advice.
The essence of investing & trading is the intelligent and patient preying on the greed, fear, impatience, addiction and ignorance of the majority. It's definitionally Darwinian.

LONG 10.9 RR, 373PIP movement on NETFLIX seeing a possible long movement on Netflix going up by £50 in value I think but a 3732.00 pip movement looks decent ngl 10.9 rr aswell

NFLX Repeat of 2011/2012 Sell Off?Currently NFLX is looking like a 1:1 copy of the sell off from 2011 and 2012. Which would imply that we see another way down in the coming months before finally bottoming.

Netflix takes breath for deep diving.As you can see on the chart, Netflix actually rises up for Gap filling.
Please mention: 30% in a few weeks.
Wait until first Gap ist Closed, then go short.

#Netflix Rising wedge with Bear divs. Get shortNetflix has a rising wedge that looks pretty much complete. We are at the high side of the pattern. STO is high so lots of room to fall. 5 bearish divergences showing the new highs are weak. Worth a short position.
Volume is insignificant compared to the volume spike on the first high.
RSI is 64 and is weaker on each new high. Buyers are running out of steam. Sellers are taking over.
Stochastic is 83 so we have topped out with plenty of rom to fall.
Target 1 = 250
Stop Loss = 345

NFLX Simple Chart AnalysisNFLX if you notice the drop was almost near to the support we draw before. It rebound & will continue to move towards a higher area here. Red chip are growing too.
Anything below 249 area will be an exit.

NFLXNot an ideal set up here for a long, looks good af to short though..
Will do that here and labeled fib levels which could offer support.
Rising wedge in the works here and 300 looks at least to be tested soon.. possibly below that if the formation breaks down.

NASDAQ NETFLEX goin short NASDAQ:NFLX
there is more than one signal showing us that the price will respect the the AB=BC pattern . and the rising wedge .

Netflix to find support at 50 EMA again?Netflix - 30d expiry - We look to Buy at 281.11 (stop at 265.74)
Our short term bias remains positive.
Intraday dips continue to attract buyers and there is no clear indication that this sequence for trading is coming to an end.
50 1day EMA is at 276.80.
The 1 day moving average should provide support at 276.80.
Daily signals are bullish.
Expect trading to remain mixed and volatile.
Early pessimism is likely to lead to losses although extended attempts lower are expected to fail.
Our profit targets will be 319.49 and 329.49
Resistance: 322.77 / 350.00 / 395.00
Support: 302.10 / 275.94 / 252.09
Disclaimer – Saxo Bank Group.
Please be reminded – you alone are responsible for your trading – both gains and losses. There is a very high degree of risk involved in trading. The technical analysis , like any and all indicators, strategies, columns, articles and other features accessible on/though this site (including those from Signal Centre) are for informational purposes only and should not be construed as investment advice by you. Such technical analysis are believed to be obtained from sources believed to be reliable, but not warrant their respective completeness or accuracy, or warrant any results from the use of the information. Your use of the technical analysis , as would also your use of any and all mentioned indicators, strategies, columns, articles and all other features, is entirely at your own risk and it is your sole responsibility to evaluate the accuracy, completeness and usefulness (including suitability) of the information. You should assess the risk of any trade with your financial adviser and make your own independent decision(s) regarding any tradable products which may be the subject matter of the technical analysis or any of the said indicators, strategies, columns, articles and all other features.
Please also be reminded that if despite the above, any of the said technical analysis (or any of the said indicators, strategies, columns, articles and other features accessible on/through this site) is found to be advisory or a recommendation; and not merely informational in nature, the same is in any event provided with the intention of being for general circulation and availability only. As such it is not intended to and does not form part of any offer or recommendation directed at you specifically, or have any regard to the investment objectives, financial situation or needs of yourself or any other specific person. Before committing to a trade or investment therefore, please seek advice from a financial or other professional adviser regarding the suitability of the product for you and (where available) read the relevant product offer/description documents, including the risk disclosures. If you do not wish to seek such financial advice, please still exercise your mind and consider carefully whether the product is suitable for you because you alone remain responsible for your trading – both gains and losses.


NFLX long if above 322As you can see by the chart trendline of wedge was broken. Long wicks circled by ellipses indicated bullish at resistance but it broke back down to take out the stop losses set by many who were anticipating a breakout. Re confirmed back above trend line with new wicks ellipses and retest for breakout to fill gap around 330. I will enter longs if above 322. Otherwise I will expect a breakdown to fill out rest of wedge from previous idea post.
Cheers!!
Trade safe have fun!
FOLLOW ME ON MY JOURNEY FROM 1K TO 10MIL!!

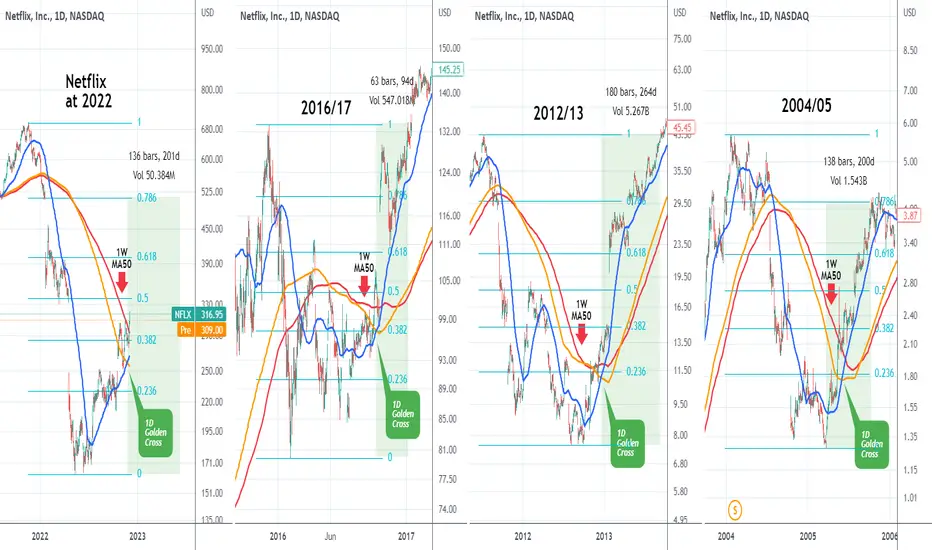
NETFLIX 1D Golden Cross historically shows fast recovery.Netflix (NFLX) completed last week the Golden Cross pattern on the 1D time-frame, which is when the 1D MA50 (blue trend-line) crosses above the 1D MA200 (orange trend-line). By doing so it closed yesterday above the 1W MA50 (red trend-line) for the first time since January 06 2022, practically when its Bear Market was confirmed.
Since it started trading, NFLX has had a 1D Golden Cross pattern while below the 1W MA50 another three times (October 07 2016, December 17 2012 and June 02 2005). On all cases, the price recovered at least the 0.786 Fibonacci, very fast. During 2016/17 it recovered the previous High in just 94 days since the 1D Golden Cross formation. In 2012/13 it recovered the previous high in 264 days, while in 2004/05 it recovered the 0.786 Fib in 200 days.
The worst case scenario of 2004/05 would have Netflix hit $511 by June 08 2023. Do you agree? Which of the 3 scenarios do you think is more likely to happen?
-------------------------------------------------------------------------------
** Please LIKE 👍, SUBSCRIBE ✅, SHARE 🙌 and COMMENT ✍ if you enjoy this idea! Also share your ideas and charts in the comments section below! This is best way to keep it relevant, support me, keep the content here free and allow the idea to reach as many people as possible. **
-------------------------------------------------------------------------------
You may also TELL ME 🙋♀️🙋♂️ in the comments section which symbol you want me to analyze next and on which time-frame. The one with the most posts will be published tomorrow! 👏🎁
-------------------------------------------------------------------------------
💸💸💸💸💸💸
👇 👇 👇 👇 👇 👇
NFLX: GAP FILL PLAY AND POTENTIAL CUP N HANDLENFLX has lost 76% from its November highs to its July lows.
Looking at the chart from a purely technical point of view, here is what I see:
- the stock has not retraced much of its down move. A 0.382 retrace would be at $366 and a 0.5 retrace would be at $428.
- There's a huge gap between $331 and $249/250. If we were to fill the gap, the target would be $331. To play the gap fill I' d wait for the price to break $250.
- A cup and handle is forming with a target between $331 and $366. However the pattern will only be confirmed should we break $250.
I'm neutral now, but I'm watching the stock closely. A break of $250 would trigger a long entry with a stop at 240.
Keep it on your watch list.
Trade safe.

$NFLX next target $148$NFLX just rejected resistance in the $300 for the second time and has fallen back below. It looks like price has formed a rising wedge of sorts and upon a breakout fo the structure, would see a breakdown to the $250 range.
However, I don't think that will be the low as price has never tested that $250 support. I think it's likely that we'll break that support area and take out the previous lows ~$170ish before bottoming in the $148 region. Let's see how it plays out.

NETFLIX $360+Looking at the daily chart of NFLX we see the Ichimoku Cloud is showing us signs of an uptrend. As price is above the cloud we can see the green is on top of the cloud and the red is now on the bottom. For NFLX to continue this trend we need to see it bounce of the green lines of the cloud... As we did not hold the red line (Kijun sen)... It is now expected for NFLX to fall to the next support level which the green line of the cloud acting as support.

Buying NFLX break higher.Netflix - 30d expiry - We look to Buy a break of 306.01 (stop at 279.87)
Short term momentum is bullish.
Short term RSI has turned positive.
A break of the recent high at 305.52 should result in a further move higher.
305.52 has been pivotal.
In our opinion this stock is undervalued.
Our outlook is bullish.
Our profit targets will be 368.68 and 378.68
Resistance: 306 / 330 / 370
Support: 290 / 280 / 252
Disclaimer – Saxo Bank Group.
Please be reminded – you alone are responsible for your trading – both gains and losses. There is a very high degree of risk involved in trading. The technical analysis , like any and all indicators, strategies, columns, articles and other features accessible on/though this site (including those from Signal Centre) are for informational purposes only and should not be construed as investment advice by you. Such technical analysis are believed to be obtained from sources believed to be reliable, but not warrant their respective completeness or accuracy, or warrant any results from the use of the information. Your use of the technical analysis , as would also your use of any and all mentioned indicators, strategies, columns, articles and all other features, is entirely at your own risk and it is your sole responsibility to evaluate the accuracy, completeness and usefulness (including suitability) of the information. You should assess the risk of any trade with your financial adviser and make your own independent decision(s) regarding any tradable products which may be the subject matter of the technical analysis or any of the said indicators, strategies, columns, articles and all other features.
Please also be reminded that if despite the above, any of the said technical analysis (or any of the said indicators, strategies, columns, articles and other features accessible on/through this site) is found to be advisory or a recommendation; and not merely informational in nature, the same is in any event provided with the intention of being for general circulation and availability only. As such it is not intended to and does not form part of any offer or recommendation directed at you specifically, or have any regard to the investment objectives, financial situation or needs of yourself or any other specific person. Before committing to a trade or investment therefore, please seek advice from a financial or other professional adviser regarding the suitability of the product for you and (where available) read the relevant product offer/description documents, including the risk disclosures. If you do not wish to seek such financial advice, please still exercise your mind and consider carefully whether the product is suitable for you because you alone remain responsible for your trading – both gains and losses.

Follower Question: Should I Buy Netflix? Recently one of my followers posed a question for us so I wanted to share my analysis into Netflix and where I see it could move.
It goes without saying but please don't use this as financial advice, DYOR and this is only shared for educational purposes.

NETFLIX retesting november highEMAS, support, resistance. NFLX has is currently near the November highs and looks pretty bullish and might break through to a new November high.

✅NETFLIX BULLISH SETUP|LONG🚀
✅NETFLIX is now retesting a strong support level
After a local correction move
And I think that we will see
A rebound and a move up
LONG🚀
✅Like and subscribe to never miss a new idea!✅

FAANG Performance Jan 01, 2022 - Nov, 08 2022 FAANG Performance Jan 01, 2022 - Nov, 08 2022
Apple -23.36%
Alphabet -39.02%
Amazon -47.20%
Netflix -55.90%
Meta -71.50%

FAANG Is about to go higher!Traders and Investors, FAANG index has reached an FCP zone which is also a previous structure level. This can create a good bounce up (BULL) opportunity for all FAANG stocks.
Facebook (Meta)
Apple
Amazon
Netflix
Google
Please support this analysis by liking and sharing. 👍🙂
Rules:
1. Never trade too much
2. Never trade without a confirmation
3. Never rely on signals, do your own analysis and research too
✅ If you found this idea useful, hit the like button, subscribe and share it in other trading forums.
✅ Follow me for future ideas, trade set ups and the updates of this analysis
✅ Don't hesitate to share your ideas, comments, opinions and questions.
Take care and trade well
-Vik
____________________________________________________
📌 DISCLAIMER
The content on this analysis is subject to change at any time without notice, and is provided for the sole purpose of education only.
Not a financial advice or signal. Please make your own independent investment decisions.
____________________________________________________
