Netflix Simple Chart AnalysisNetflix in a retracement pattern here. Monitor the breakout cause once this ended, it will retest 332 resistance area here. Red chip piling up.
Jokes aside : Squid S2 incoming ! this might give a boost on it haha.
Netflix

For day traders! onlytrade tesla long the next few days, YES I KNOW THE MARKET BERISH but we have a probability that the stock we test 265.67usd if we break the 229.56usd level.

strong bullish signal on NETFLEXHello ladies and gentlemen, according to my graphical and earnings report analysis on NFLX , there is a high probability of an increase towards over 369.00$ in the next few weeks.

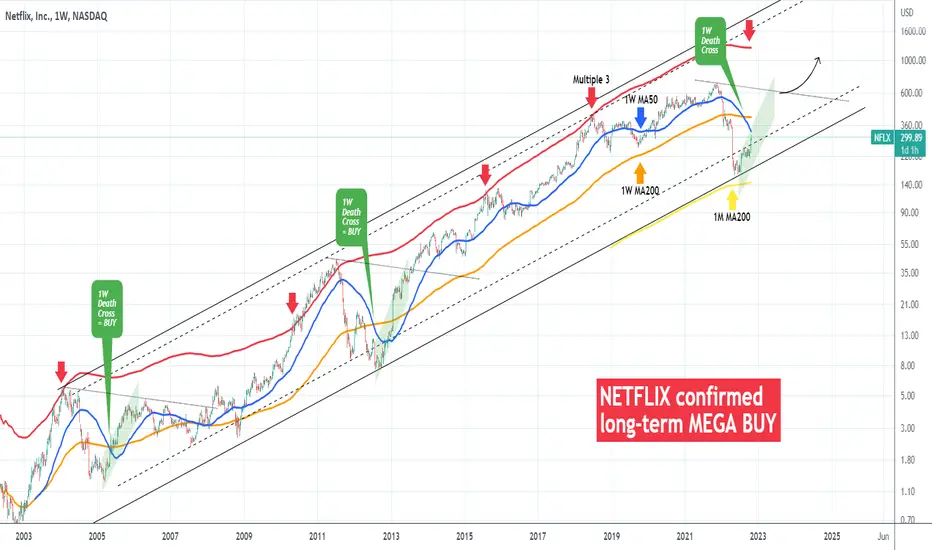
NETFLIX gives a confirmed MEGA BUY signalWe've been bullish on Netflix (NFLX) since early Summer after the price held the 1M MA200 (yellow trend-line), which as we noted on our April 21 analysis, is the historical Support:
Even though the drop didn't complete the expected -80% drop, it did come close enough (-76.50%) and as you see the rebound since the mid May bottom has been massive already (+87%). The price is now close to hitting the 1W MA50 (blue trend-line) for the first time since the first week of January.
The current analysis is on the 1W time-frame and illustrates NFLX's long-term price action since it's first trading day. Though the scale is logarithmic, we can fit the price action within a Channel Up. The recent May bottom was exactly on the Channel's bottom (Higher Lows trend-line) just like the previous Higher Low in late July 2012.
The catalyst that is making us claim that Netflix formed a bottom and is giving a confirmed long-term buy signal is the fact that the price continues to rise even after the formation of the Death Cross (bearish signal technically), which is when the 1W MA50 crosses below the 1W MA200 (orange trend-line). In all (2) previous occurrences (July 2012, April 2005), the stock price had already formed its bottom and was at the start of a very aggressive rally towards its previous All Time High. The current Death Cross was formed in August (2022) and the +87% already shows how this is similar to past bottoms.
There is a Lower Highs trend-line involved (dotted line) which during the past two rallies, was the initial target. In the 00s the price took a while before making a new All Time High while in the early 2010s it took just a few months after touching the (dotted) Lower Highs trend-line. As a long-term target, an investor could use the Multiple 3 (red trend-line), from the Fib MAs indicator.
-------------------------------------------------------------------------------
** Please LIKE 👍, SUBSCRIBE ✅, SHARE 🙌 and COMMENT ✍ if you enjoy this idea! Also share your ideas and charts in the comments section below! This is best way to keep it relevant, support me, keep the content here free and allow the idea to reach as many people as possible. **
-------------------------------------------------------------------------------
You may also TELL ME 🙋♀️🙋♂️ in the comments section which symbol you want me to analyze next and on which time-frame. The one with the most posts will be published tomorrow! 👏🎁
-------------------------------------------------------------------------------
👇 👇 👇 👇 👇 👇
💸💸💸💸💸💸
👇 👇 👇 👇 👇 👇
Netflix turning up?If there are enough buyers, NASDAQ:NFLX might close above the 200MA, after months of trading below this level.

Netflix 100% jump Hey friends, Netflix reported positive earnings again for the first time in Q3 2022. What a coincidence, though, that the stock has been trending upward again for 162 days. The Netflix stock has gained almost 80% in value and the recently published quarterly figures seem to indicate that we have finally seen the bottom of the streaming giant.
Netflix has now completed its first five-part run with a high at around $288, but which can still easily extend to $300. After that, I expect a wave 2 sell-off to the 0.786 retracement at $190.23.
If the share rises sustainably in a wave 3, a price jump of at least 100% is possible! The wave 3 reaches at least the 1.618 extension at 394.14$ (107.41%)
So the next time at NFLX will be exciting!

Netflix Ready To Recover FurtherFrom 2007 to 2022, Netflix’s subscriber base grew from 7 million to 221 million, nearly 3,000%. Netflix is known as one of the pioneers of mass streaming of audiovisual content. Founded in 1997, Netflix began as a mail-order DVD rental company. One of the co-founders, Reed Hastings, told Fortune magazine that he got the idea for Netflix after being overdue a $40 charge for a VHS he had rented.
By 2007, Netflix had grown from a relatively modest DVD rental company to a groundbreaking subscription-based streaming service. While there were few other streaming platforms at the time, Netflix had a significant first-mover advantage, operating on a subscription model and acquiring a wide range of distribution rights from different studios. This allowed the company to grow quickly and establish itself as an industry leader.
The service has become so powerful that the word “Netflix” is now synonymous with watching a movie or TV show. But while it’s one of the most recognized streaming platforms in the world, has it managed to maintain its dominant position in the industry now that more competitors have entered the fray?
In April 2022, Netflix shared its first quarter results that showed a loss of 200,000 subscribers. Although just a fraction of its 200+ million subscribers, it was Netflix’s first subscriber drop in more than 10 years. This sent the company’s share price below $200, the lowest since 2017. As of October 10, 2022, its share price is still at $230, over 30% below the pre-announcement.
But change for the company is on the horizon. Netflix announced plans to launch a cheaper ad-supported service in November — something other streaming platforms like Peacock and Paramount+ have already been offering customers for a few years.
As the chart shows, Netflix after a huge upward movement to 700.99 dollars with a top of a five wave sequence that was reversed by a sharp five-wave drop, so we see that as wave (A); still only one leg of a higher degree weakness. Now the stock will reach higher prices since it is within a (B) wave of a zig-zag pattern as of an (A) – (B) – (C). So, we can see lower lows in the long-term, ut before that we may see rally into 360-400 area.

NETFLIX - personal opinion Hello everyone,🙋🏾
🗣Here again Rom with a personal opinion,
All traders have experienced the frustration of being “the last one to the party.” Missing the run.
And I think an opportunity has been created here, quietly and slowly.
I don't think it's necessary to introduce Netflix,
The big streaming company. NASDAQ:NFLX
Company data ✅
Market Cap 108.28B💰
P/E 22.54
Income 4.84B
Sales 31.03B
JP Morgan Target Price $240 → $330💥
Deutsche Bank Target Price $270 → $350💥
🎉Netflix has stopped losing customers, after struggling to hold on to them in the face of competition and pressures from the rising cost of living.
The streaming giant said it added 2.4 million households to its subscriber base over the July to September period.
That reversed the losses it suffered in the first half of the year after raising its prices in key markets.
Hits such as Stranger Things and Monster: The Jeffrey Dahmer Story helped draw viewers back to the site.
"After a challenging first half, we believe we're on a path to reaccelerate growth," the company said in a letter to investors on Tuesday.
The company said it expected to continue to add subscribers in the coming months. It is also rolling out several changes intended to restore its fortunes, including launching a less expensive option with adverts next month.
Those who want to be exposed to the stock indirectly can do so through the following ETF:🎲
Ticker_____Fund Name _________________ # OF SHARES
QQQ _____Invesco QQQ Trust_________________ 6.46M
SPY ____ SPDR S&P 500 ETF Trust____________4.83M
IVV _____iShares Core S&P 500 ETF ______ ____3.96M
VOO____ Vanguard S&P 500 ETF______________3.49M
VTI_____ Vanguard Total Stock Market ETF____ 2.96M
More content, follow me, express your opinion, and share me.💃🏿
⚠️__🚧___🚧___🚧__🚧___🚧__🚧_🚧__🚧__🚧__🚧__🚧_🚧__🚧__🚧_🚧__🚧_⚠️
There is no recommendation for buying or selling or any action in the stock, I am not an investment advisor and publish this article as a hobby only.
Everyone has to perform risk management on their own or contact an investment advisor with a license, I don't have one.
Investing in the stock market involves risking your money!⛔️
have fun💃🏿

Netflix destroyed slowly until someone buy the companyNetflix destroyed slowly until someone buy the company And stop supporting gays.
It’s now in second wave that targeted 36$ after that we will see big pump in it.
This analysis for long-term.

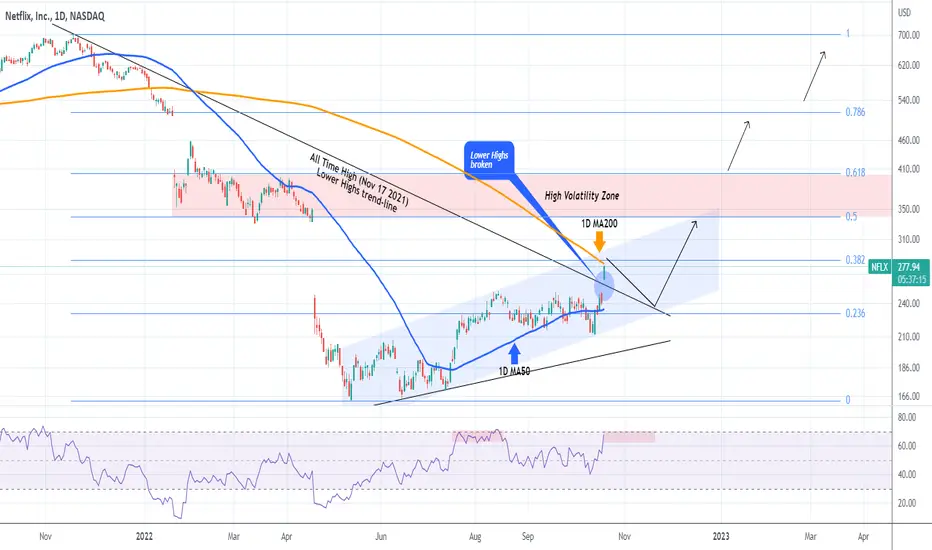
NETFLIX +15% near the 1D MA200 for the first time since January!Netflix (NFLX) had its highest daily opening in over one year, rising so far +15.21% form a 240.86 close yesterday to a 277.50 intra day peak. This is of course a fundamental move due to the big earnings surprise yesterday (3.1 EPS against a 2.18 forecast). Technically, this brings the price just below the 1D MA200 (orange trend-line), which has been untouched since January 05 2022!
A break above it has to be backed-up by new fundamentals though as there is a strong Resistance Cluster formed by both the 0.382 Fibonacci retracement level and the top (Higher Highs trend-line) of the Channel Up that started in mid-May. If that rejection occurs, then buying again on the 1D MA50 (blue trend-line) would be the most optimal low risk strategy, targeting just below the 0.5 Fibonacci level at 330.00. Further long-term buys can be taken, in our view, only above the 0.618 Fib which is the top of the High Volatility Zone of January - April 2022.
P.S. Check our previous analysis on Netflix in an attempt to price a good long-term buy. Has been working out very well so far:
-------------------------------------------------------------------------------
** Please LIKE 👍, SUBSCRIBE ✅, SHARE 🙌 and COMMENT ✍ if you enjoy this idea! Also share your ideas and charts in the comments section below! This is best way to keep it relevant, support me, keep the content here free and allow the idea to reach as many people as possible. **
-------------------------------------------------------------------------------
You may also TELL ME 🙋♀️🙋♂️ in the comments section which symbol you want me to analyze next and on which time-frame. The one with the most posts will be published tomorrow! 👏🎁
-------------------------------------------------------------------------------
👇 👇 👇 👇 👇 👇
💸💸💸💸💸💸
👇 👇 👇 👇 👇 👇
Netflix and rally to $338.39Cup & Handle formed on daily.
Gap close is likely.
RSI broken above 50 and out of the downtrend (Bullish momentum)
Target $338.39
Concerns:
Moving averages are still down
200 > Price.
Overall downtrend still evident
Bias- bullish

my day trade plan on NETFLEX.Disclaimer: I do not give solicitation to buy or short
==
I cover various stocks which can be profitable based on the stock charts and technical indicators. I try my best to explain as detailed as possible but your feedback is also appreciated
Before you enter a trade , one must learn how to master the charts as Stock charts play a big role in deciding when to buy or when not to buy. Technical Trading help in predicting price movements and have a risk management. Stock trading is like any other business and must be taken seriously. Lot of people lose money because they don't educate themselves and end up placing trades blindly which results in big losses
Stock charts is the major component day traders, swing traders, core traders use. Times and technology has changed and if you cannot adapt to the new methods , there is a high chance you will be left behind
Millions of shares are traded now using desktop , laptop or gadgets and stock charts is what majority of traders look at.
So , if you want to be a daytrader , swingtrader or coretrader learn how to read and interpret charts. There are lot of great books out there like Thomas Bulkowski's Encyclopedia of chart patterns and Steve Nison Japanese Candlesticks interpretation
Having someone experienced can also cut the learning curve time for a new trader. Trading does take time and with discipline , hardwork , dedication and most importantly Passion for this needs to be there.


NETFLIXYou can see NETFLIX is at the resistance box, I'd say it won't break it and it will go to 184$ nPOC, VAL level is the last support and below it we are looking for NTFLX to hit 140-150$ nPOC, there we can expect bounce.

NETFLIX AND CHILL? BEARISH DIVERGENCES FORMINGBearish Divergences forming on daily timeframe.
We expect the stock market to pull back in the next days therefore Netflix may retest the support one more time to build a strong base before filling the gap.
Be patient, wait for a pullback .
Buy low, sell high

NETFLIX: SAME SCENARIO?Hi guys, i'm looking some stock to buy in the coming weeks/months if market will collapse and for now i'm watching carefully Netflix.
What do you think?
Is the 2012 crash similar to today situations?
Let me know, for now i'm just looking at some good entry point to start accumulating

Netflix ready for another breakdown?Netflix - Intraday - We look to Sell a break of 214.49 (stop at 224.21)
Price continues to trade within the triangle formation.
Posted a Double Top formation.
Trend line support is located at 218.00.
A break of the recent low at 214.69 should result in a further move lower.
214.69 has been pivotal.
Daily signals are bearish.
Short term momentum is bearish.
There is no clear indication that the downward move is coming to an end.
Our profit targets will be 191.61 and 182.61
Resistance: 230.00 / 240.00 / 250.00
Support: 215.00 / 200.00 / 190.00
Disclaimer – Saxo Bank Group. Please be reminded – you alone are responsible for your trading – both gains and losses. There is a very high degree of risk involved in trading. The technical analysis , like any and all indicators, strategies, columns, articles and other features accessible on/though this site (including those from Signal Centre) are for informational purposes only and should not be construed as investment advice by you. Such technical analysis are believed to be obtained from sources believed to be reliable, but not warrant their respective completeness or accuracy, or warrant any results from the use of the information. Your use of the technical analysis , as would also your use of any and all mentioned indicators, strategies, columns, articles and all other features, is entirely at your own risk and it is your sole responsibility to evaluate the accuracy, completeness and usefulness (including suitability) of the information. You should assess the risk of any trade with your financial adviser and make your own independent decision(s) regarding any tradable products which may be the subject matter of the technical analysis or any of the said indicators, strategies, columns, articles and all other features.
Please also be reminded that if despite the above, any of the said technical analysis (or any of the said indicators, strategies, columns, articles and other features accessible on/through this site) is found to be advisory or a recommendation; and not merely informational in nature, the same is in any event provided with the intention of being for general circulation and availability only. As such it is not intended to and does not form part of any offer or recommendation directed at you specifically, or have any regard to the investment objectives, financial situation or needs of yourself or any other specific person. Before committing to a trade or investment therefore, please seek advice from a financial or other professional adviser regarding the suitability of the product for you and (where available) read the relevant product offer/description documents, including the risk disclosures. If you do not wish to seek such financial advice, please still exercise your mind and consider carefully whether the product is suitable for you because you alone remain responsible for your trading – both gains and losses

Netflix in an ascending triangle.Netflix - 30D expiry - We look to Buy a break of 252.11 (stop at 234.98)
Daily pivot is at 251.99.
A break of yesterdays high would confirm bullish momentum.
We are trading at oversold extremes.
Although an initial rally was posted, sellers emerged and follow through bearish momentum resulted in all the previous day's gains being overturned.
Daily signals are mildly bullish.
Although we remain bullish overall, a correction is possible with plenty of room to move lower without impacting the trend higher.
The trend of higher lows is located at 217.00.
Price action has formed a bullish ascending triangle formation.
Our profit targets will be 297.88 and 307.88
Resistance: 245.00 / 252.00 / 260.00
Support: 230.00 / 220.00 / 215.00
Daily perspective
Disclaimer – Saxo Bank Group. Please be reminded – you alone are responsible for your trading – both gains and losses. There is a very high degree of risk involved in trading. The technical analysis , like any and all indicators, strategies, columns, articles and other features accessible on/though this site (including those from Signal Centre) are for informational purposes only and should not be construed as investment advice by you. Such technical analysis are believed to be obtained from sources believed to be reliable, but not warrant their respective completeness or accuracy, or warrant any results from the use of the information. Your use of the technical analysis , as would also your use of any and all mentioned indicators, strategies, columns, articles and all other features, is entirely at your own risk and it is your sole responsibility to evaluate the accuracy, completeness and usefulness (including suitability) of the information. You should assess the risk of any trade with your financial adviser and make your own independent decision(s) regarding any tradable products which may be the subject matter of the technical analysis or any of the said indicators, strategies, columns, articles and all other features.
Please also be reminded that if despite the above, any of the said technical analysis (or any of the said indicators, strategies, columns, articles and other features accessible on/through this site) is found to be advisory or a recommendation; and not merely informational in nature, the same is in any event provided with the intention of being for general circulation and availability only. As such it is not intended to and does not form part of any offer or recommendation directed at you specifically, or have any regard to the investment objectives, financial situation or needs of yourself or any other specific person. Before committing to a trade or investment therefore, please seek advice from a financial or other professional adviser regarding the suitability of the product for you and (where available) read the relevant product offer/description documents, including the risk disclosures. If you do not wish to seek such financial advice, please still exercise your mind and consider carefully whether the product is suitable for you because you alone remain responsible for your trading – both gains and losses

NETFLIXHELLO GUYS THIS MY IDEA 💡ABOUT NTFLX is nice to see strong volume area....
Where is lot of contract accumulated..
I thing that the buyers from this area will be defend this long position..
and when the price come back to this area, strong buyers will be push up the market again..
UPTREND + Support from the past + Strong volume area is my mainly reason for this long trade..
IF you like my work please like share and follow thanks
TURTLE TRADER 🐢

9/11/22 NFLXNetflix, Inc ( NASDAQ:NFLX )
Sector: Technology Services (Internet Software/Services)
Market Capitalization: $103.870B
Current Price: $233.57
Breakout price trigger: $236.60
Buy Zone (Top/Bottom Range): $232.30-$211.85
Price Target: $246.60-$250.60 (1st), $298.20-$304.00 (2nd)
Estimated Duration to Target: 13-15d (1st), 54-57d (2nd)
Contract of Interest: $NFLX 9/23/22 235c, $NFLX 11/18/22 240c
Trade price as of publish date: $8.00/contract, $20.95/contract

Shorting Netflix. NFLXThis company has not been getting a lot of good press lately with its film adaptations of historical events and figures. We remain separate from political discussions on this channel, as all we care about is the technical picture of this particular stock at this particular moment.
Divergence detected, clearing an extended, upgoing flat, leaving room for a drop of one size or another.
We are not in the business of getting every prediction right, no one ever does and that is not the aim of the game. The Fibonacci targets are highlighted in purple with invalidation in red. Confirmation level, where relevant, is a pink dotted, finite line. Fibonacci goals, it is prudent to suggest, are nothing more than mere fractally evident and therefore statistically likely levels that the market will go to. Having said that, the market will always do what it wants and always has a mind of its own. Therefore, none of this is financial advice, so do your own research and rely only on your own analysis. Trading is a true one man sport. Good luck out there and stay safe.

NFLXHELLO GUYS THIS MY IDEA 💡ABOUT NFLX is nice to see strong volume area....
Where is lot of contract accumulated..
I thing that the Seller from this area will be defend this SHORT position..
and when the price come back to this area, strong SELLER will be push down the market again..
DOWNTREND + Support from the past + Strong volume area is my mainly reason for this short trade..
IF you like my work please like share and follow thanks
TURTLE TRADER 🐢
