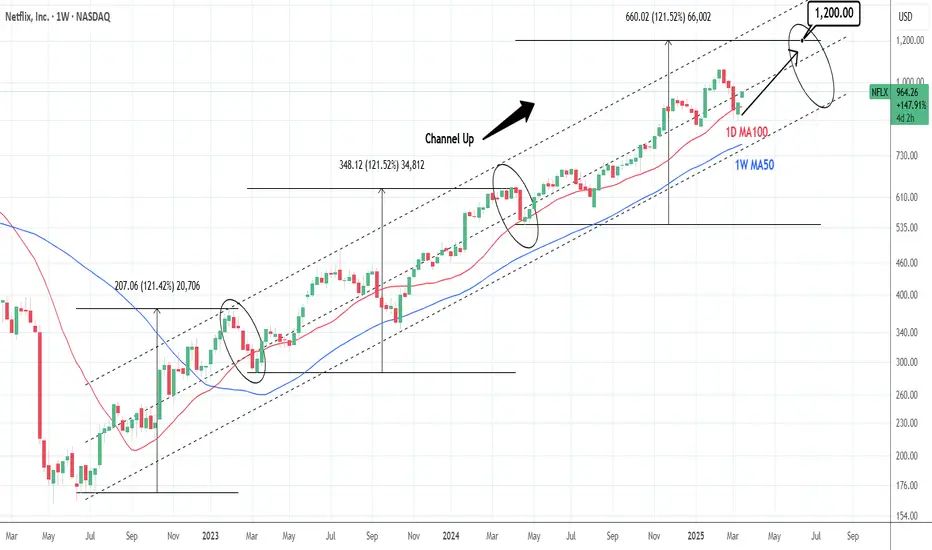
NETFLIX: Strong buy opportunity with this 1D MA100 bounce.Netflix is neutral on its 1D technical outlook (RSI = 52.399, MACD = -10.400, ADX = 30.636) and is rebounding on the 1D MA100. This is another HL on the 20 month Channel Up, which should be enough to give the stock a push to a new HH. The Channel Up is on its 3rd main bullish wave and both prior saw a +121.52% price increase. We expect the 3rd one to be completed by July. The trade is long, TP = 1,200.
## If you like our free content follow our profile to get more daily ideas. ##
## Comments and likes are greatly appreciated. ##
Netflix
Netflix: New All-time High!As expected, Netflix reached a new all-time high at $1,067, completing the magenta wave . Since then, the stock has already pulled back by nearly 20%. The ongoing magenta wave should extend further into our new magenta Target Zone, which spans $789.04 to $704.43. Since we anticipate a sustainable rebound from this range, it presents an opportunity to initiate or expand long positions. Such long entries could be hedged with a stop 1% below the Zone’s lower boundary, as there is a 30% chance that Netflix will drop below the Zone to complete the green wave alt. .

Netflix (NFLX) Shares Among the Biggest Losers in the US MarketNetflix (NFLX) Shares Among the Biggest Losers in the US Stock Market
According to market charts:
→ Netflix (NFLX) shares fell by approximately 8.5% during yesterday’s trading session, indicating that bulls failed to sustain the price above the psychological $1,000 per share level.
→ The S&P 500 index (US SPX 500 mini on FXOpen) hit a new low for 2025, closing down around 1.3%.
These declines reflect bearish sentiment in the US stock market, which may be driven by:
→ Uncertainty over Trump’s trade tariff policies. Yesterday, the White House postponed the introduction of tariffs on trade with Canada and Mexico for a second time, now pushing the deadline to early April.
→ Anxiety ahead of the Non-Farm Employment Change report release (scheduled for today at 16:30 GMT+3), as recession fears continue to mount.
Selling pressure was particularly strong in Netflix (NFLX) shares, as analysts (according to media reports) issued a cautious outlook on subscriber growth for the streaming giant. This may stem from concerns that the company's low-cost, ad-supported subscription model is losing its initial positive impact.
Technical Analysis of Netflix (NFLX) Stock Chart
Price movements in 2025 have formed an upward channel (marked in blue), which remains intact for now.
The $955 level, which previously acted as support, may now serve as resistance. If bearish sentiment persists, the price could continue its downward trajectory. However, bulls may find hope in key support areas, including:
→ The lower boundary of the current price channel.
→ The $870 level, which marks the lower limit of a broad bullish gap formed after a strong quarterly earnings report (as we noted on 23 January). This level has also acted as a key reversal point multiple times.
Analysts’ Forecasts for Netflix (NFLX) Stock
Overall, analysts remain optimistic. According to TipRanks:
→ The average 12-month price target for NFLX is $1,100.
→ 29 out of 37 analysts recommend buying NFLX shares.
Trade on TradingView with FXOpen. Consider opening an account and access over 700 markets with tight spreads from 0.0 pips and low commissions from $1.50 per lot.
This article represents the opinion of the Companies operating under the FXOpen brand only. It is not to be construed as an offer, solicitation, or recommendation with respect to products and services provided by the Companies operating under the FXOpen brand, nor is it to be considered financial advice.

NETFLIX: First warning of the END of the retracement!
On January 22, Netflix presented results that widely beat market estimates:
--> Sales 10,247 million dollars (+16% YoY) vs. 10,106 million dollars estimated by the consensus and 10,128 million dollars estimated by the company.
--> EBIT 2,243 million dollars (+52%) vs. 2,200 million dollars consensus and 2,190 million dollars estimated by the company.
--> BNA 1,869 million dollars (+99%) vs. 1,830 million dollars consensus and 1,847 million dollars estimated by the company.
--> EPS 4.27 dollars (+102%) vs. 4.18 dollars consensus and 4.23 dollars estimated by the company.
New subscriptions reach +18.9M, +44% YoY, vs. +9.2M expected. As anticipated by the Company, this is the last quarter in which it will publish this data. Total subscriptions exceed 301M (+15.9% YoY).
-----------------------------------------------------------------
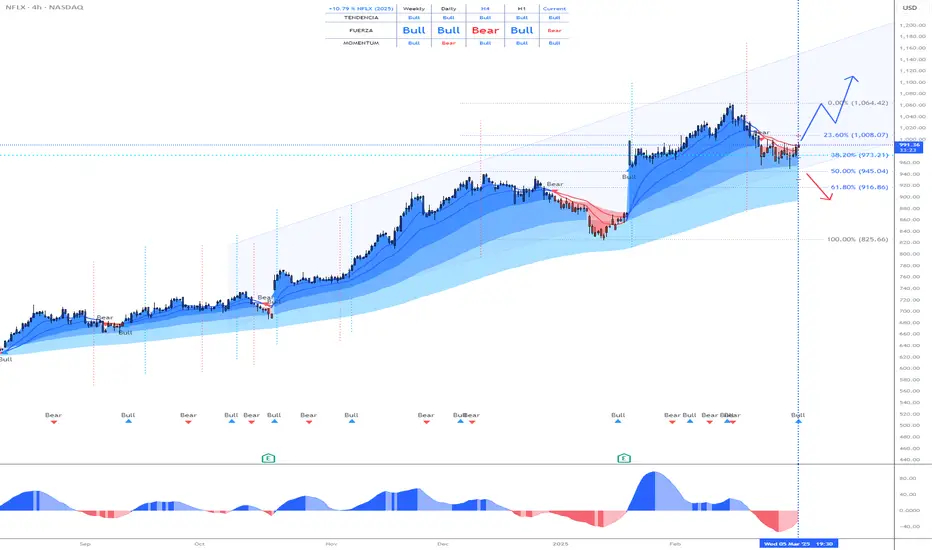
The share price reached its historical maximum on February 18th at 1,064 and has not stopped falling since then, due to the fact that the Nasdaq index began a correction caused mainly by the volatility generated by trade tariffs.
--> What is the technical situation?
The technical aspect is CLEARLY BULLISH and any setback in the price will be a good opportunity to enter the stock.
It has reached a 50% Fibonacci retracement (945), an area that it has respected, and that therefore, can be taken as the LOWER to start a NEW BULLISH IMPULSE.
--> What risks does it have?
Trump's TARIFFS, since they can cause falls in the NASDAQ INDEX that drag down the entire market. But the Nasdaq index is in a VERY PROBABLE LOWER area, so the ENTIRE market could rise strongly in the next few days.
-------------------------------------
Strategy to follow:
ENTRY: We will open 2 long positions if the H4 candle closes above 992
POSITION 1 (TP1): We close the first position in the maximum area (1,061) (+7%)
--> Stop Loss at 940 (-5%).
POSITION 2 (TP2): We open a Trailing Stop type position.
--> Initial dynamic Stop Loss at (-5%) (coinciding with the 940 of position 1).
--> We modify the dynamic Stop Loss to (-1%) when the price reaches TP1 (1,061).
-------------------------------------------
SET UP EXPLANATIONS
*** How do we know which 2 long positions to open? Let's take an example: If we want to invest 2,000 euros in the stock, what we do is divide that amount by 2, and instead of opening 1 position of 2,000, we will open 2 positions of 1,000 each.
*** What is a Trailing Stop? A Trailing Stop allows a trade to continue gaining value when the market price moves in a favorable direction, but automatically closes the trade if the market price suddenly moves in an unfavorable direction by a certain distance. That certain distance is the dynamic Stop Loss.
-->Example: If the dynamic Stop Loss is at -1%, it means that if the price drops by -1%, the position will be closed. If the price rises, the Stop Loss also rises to maintain that -1% in the rises, therefore, the risk is increasingly lower until the position becomes profitable. In this way, very solid and stable price trends can be taken advantage of, maximizing profits.
NFLX - NetFlix is overhyped an TA says tooBesides what I think about NFLX (bad for you, poor quality & service, lairs etc.), there is something that can be used to rate and judge a Stocks pricing - The Technical Analysis.
The white Fork projects the most probable path of price. The U-MLH is the upper stretch, the L-MLH the lower and the CL is the Center, where price is in equilibrium.
Where is price now?
It mooned to the upper Warning-Line!
Such moves are insane, crazy, not healthy and produce by manipulation and/or greed that eats Brains.
However - As I follow the rules of the Medianlines (Forks), I know that price is hyper extended up there. So, it can't go further? Of course it could. But Chances are poor that it will.
Instead, Chances are high that price falls down to the U-MLH. At least.
Why?
Besides price is stretched, it failed to move up to the next Warning Line (WL2).
So, there you have it.
I'm shorting NFLX and my target is at least the U-MLH, with further downside potential with PTG2 at the Centerline.

Bonus Analysis: 80 Stocks Reviewed, 15 Stand Out!Hello readers!
First things first – if you find value in these analyses, don’t hesitate to hit the Boost/Like button! 🚀 Your support helps keep these ideas coming and is greatly appreciated. Thanks a lot!
As an extra bonus for everyone who participated in the survey, I decided to go through all the mentioned stocks—a total of 80 different names—and pick out the ones that stood out to me from a technical perspective. Made just a brief overview.
Previously, I covered the top 15 most mentioned stocks, but now it's time to highlight 15 additional setups that caught my eye with very short descriptions. These are purely technical insights—no fundamental analysis here.
To be said, many of the stocks mentioned were at all-time lows, which means technical analysis isn’t much help. If a stock is sitting at the bottom with no structure, you’re relying purely on fundamentals to make a decision.
With that said, let’s take a look at the charts that stood out.
1. Oklo (OKLO) – Nuclear Energy
Strong momentum, but for me, the most important area is $20 to $30.
2. Tecnoglass (TGLS) – Glass and Window Manufacturing
Steady higher highs - The strongest zone sits between $50 to $60.
3. MicroStrategy (MSTR) – Software and Bitcoin Holdings
Extremely volatile but key interest zones for me are $170 to $240, with $200 as a strong mid-point.
4. Everest Group (EG) – Reinsurance and Risk Management
$250 to $280 was a strong resistance, now acting as support. Trendline retest and third-touch scenario align well with the $230 to $280 range.
5. H. Lundbeck (HLUN_B) – Pharmaceuticals
Resistance turned support has already played out but still, there might be some volatility, and $35 to $40 DKK remains the strongest zone.
6. Alpha Group International (ALPH) – Financial Services
Breakout and retest already worked well, so waiting for slightly better prices might be the best move but it is valid.
-------
I’ve picked out the first six stocks from the survey and shared my technical insights here on TradingView but this is just the beginning.
9 stocks in Substack with some bigger names like Alibaba (BABA), Starbucks (SBUX), Snowflake (SNOW), Uber (UNER), and Netflix (NFLX) have also caught my eye, and I’ll be covering them on my Substack along with more technical breakdowns.
Substack-ENG link is in my BIO (clicking the website icon), or you can find it by scrolling up - just below the main image.
See you there,
Vaido

Netflix - We Know What Will Happen Next!Netflix ( NASDAQ:NFLX ) will retest the trendline next:
Click chart above to see the detailed analysis👆🏻
About six years ago, Netflix started the creating of a reverse triangle pattern, perfectly trading between the two trendlines. We already witnessed such a behaviour back in 2012 and following this previous bullish cycle, it is super likely that Netflix will head even higher.
Levels to watch: $1.200
Keep your long term vision,
Philip (BasicTrading)

NFLX Netflix Options Ahead of EarningsIf you haven’t entered NFLX in the buy zone:
Now analyzing the options chain and the chart patterns of NFLX Netflix prior to the earnings report this week,
I would consider purchasing the 850usd strike price Calls with
an expiration date of 2025-1-24,
for a premium of approximately $41.75.
If these options prove to be profitable prior to the earnings release, I would sell at least half of them.

Sell, Hold, or Hope? Netflix Approaches $1000Hi,
Looking at Netflix's historical price behavior around psychological round numbers ($100, $500), we see a pattern that indicates it might be a good idea to lock in some profits at these levels.
Why?
- Round numbers often act as psychological barriers where prices tend to consolidate or range for a while, limiting further growth.
- There's a significant chance of a correction, especially after a strong rally like the one we've seen recently.
Both of these scenarios suggest it's worth considering taking some money off the table. One thing is for sure: please avoid letting FOMO influence your decisions at these prices - don't buy it at the moment. There will be better changes, just be patient enough!
Historical Examples of Psychological Round Numbers
$100 Level (2015-2016)
In July 2015, Netflix approached the $100 level. While it did show some upward movement, the price largely ranged around this area until late 2016. It was stuck for months, offering limited returns for those who didn't react.
$500 Level (2021-2022)
Around $500, Netflix once again demonstrated the same behavior. For about a year, the stock did little more than range around this level. This shows how powerful round numbers can be as areas of stagnation.
Current Major Level: $1000
While Netflix has surpassed previous round numbers, $1000 is shaping up to be the most significant psychological level yet. The rise to this point has been enormous, and history suggests that sooner or later, a correction is likely.
If you're not prepared to hold through a potential correction or consolidation, the current price levels might be an ideal time to lock in profits. Long-term holders who stick to their thesis might choose to ride this out, the choice is yours. However, for mid-term investors, locking in some gains here could be a wise move!
"Sell, Hold, or Hope?"
Let's say in that way - I hope that some holders will sell around current prices! ;)
All the best,
Vaido

Netflix Crushes It Again as Shares Near $1,000. Where Rivals At?The smash-hit nail-biting Korean drama Squid Game, French mystery thriller Lupin or VR-infused 3 Body Problem. These are all Netflix Original titles that take us out of the ordinary and into a whirlwind of sensations and visual and emotional excess.
Only that we can have those sensations IRL thanks to the hype train called Netflix stock NFLX — the streaming pioneer schleps us on wild gyrations across the chart — sometimes super scary but sometimes unbelievably good. This time it was the latter.
“I can’t hear you over the sounds of ♫ RING-A-RING-A-RING ♫ blasting out of the speakers of more than 68 million viewers” — Netflix to its competition, probably, as it reported a bombastic quarter with a record number of subscribers.
The very-fabulous, bumper three months to December picked up 19 million paid users (how many of these were day trading while binging?) as Squid Gain Game dialed up more than 68 million views in its first week. The other big hit, Jake Paul vs Mike Tyson boxing live, whipped up 65 million streams.
It was also the perfect quarter to end the practice of reporting subscriber growth. Starting with the current three months to March, the streaming platform won’t be announcing how many new users are onboarded as it shifts the focus to traditional financial metrics like revenue growth and profits.
The shares soared as much as 15% in after-hours activity following the earnings report. They opened for regular trading on Wednesday and hit an all-time session high of $999 a piece. On the way, Netflix crossed a $400 billion valuation.
Here’s a quick rundown of the numbers for the fourth quarter:
Earnings per share: $4.27 vs. $4.20 expected
Revenue: $10.25 billion vs. $10.11 billion expected
Total paid memberships: 301.63 million vs. 290.9 million expected
It was the tech titan’s seventh consecutive quarter of rising profits, up 27% from the year-ago period. Looking ahead, Netflix plans to spend $18 billion on new content in 2025 while revenue is expected to be between $43.5 billion and $44.5 billion, up 14% from last year. Operating margin is projected to hit 29%.
Besides ads, one other thing is supposed to help Netflix get to its lofty guidance — price hikes. The streaming platform will be asking for more cash in the US, Canada, Portugal and Argentina. Here’s what’s changing in the US:
Ad-tier $6.99 > $7.99/mo.
Standard $15.49 > $17.99/mo.
Premium $22.99 > $24.99/mo.
“We’re fortunate that we don’t have distractions like managing declining linear networks and, with our focus and continued investment, we have good and improving product/market fit around the world,” the company said in its earnings report Tuesday.
“We enter 2025 with strong momentum, coming off a year with record net (subscriber) additions and having re-accelerated growth,” it added.
Where’s the competition at? Let’s look at Disney DIS , the closest rival. Disney expects to spend about $24 billion on new content in 2025, up from $23.4 billion. Yet it has about half the subscribers of Netflix — around 154 million.
Other prominent contenders in the streaming war are not even close — Apple AAPL and Amazon AMZN . Apple doesn’t disclose Apple TV+ subscribers and Amazon doesn’t disclose Prime subscribers.
Third-party estimates point to about 50 million to 75 million Apple TV+ users. Amazon Prime, which is tied to the ecommerce platform’s delivery service, has about 200 million customers.
But let’s give it to them — Apple and Amazon have got a bunch of diversified revenue streams, while Netflix has stuck to its OG mission of being a streaming platform.
In any case, this streaming war is not over, so it's worth keeping an eye on company updates and reports in the earnings calendar . (Hint: Disney earnings arrive February 5.)
Where do you think the streaming wars are headed in 2025? Share your thoughts on Netflix, Disney, and the rest in the comments!

NFLX - It's not too late!It's not too late...
You have a 60-70% chance of grabbing NASDAQ:NFLX at $920 on the retest!
Stay patient, stay ready
Not financial advice

Netflix (NFLX) Shares Surge After Earnings ReportNetflix (NFLX) Shares Surge After Earnings Report
After the close of the main trading session on the stock market on Tuesday, Netflix released its Q4 2024 results. The report was exceptionally strong:
→ Analysts expected the company to add 9.18 million paid subscribers during the quarter, but the actual figure reached 18.91 million, which is 15.9% more than in the same quarter last year.
→ Total subscribers reached 300 million.
→ Earnings per share amounted to $4.27 (expected: $4.20).
→ Gross revenue: actual = $10.25 billion, expected = $10.11 billion.
The company’s success was supported by products such as Squid Game, Bridgerton, and Nobody Wants This. During the quarter, 55% of customers chose ad-supported plans, and subscriptions to this plan grew by 30%. Netflix executive Gregory Peters believes that advertising revenue could double between 2024 and 2025.
As shown by the Netflix (NFLX) stock chart, the market has experienced increased volatility following the release of the report. On 22 January:
→ Trading opened with a wide bullish gap – approximately 14% higher than the closing price on 21 January.
→ However, during yesterday’s trading session, shares fell by approximately 4%, indicating that the initial reaction to the positive news might have been overly optimistic.
According to technical analysis of the NFLX chart, it is reasonable to assume that after a rise towards the psychological level of $1,000, the market is vulnerable to a correction. After touching the upper boundary of the ascending channel, the price could retreat to its median around the $910 level, which also corresponds to a 50% retracement of the A→B impulse.
According to TipRanks:
→ The average price target for NFLX shares in 12 months is $986.
→ 20 out of 29 analysts recommend buying NFLX shares.
Trade on TradingView with FXOpen. Consider opening an account and access over 700 markets with tight spreads from 0.0 pips and low commissions from $1.50 per lot.
This article represents the opinion of the Companies operating under the FXOpen brand only. It is not to be construed as an offer, solicitation, or recommendation with respect to products and services provided by the Companies operating under the FXOpen brand, nor is it to be considered financial advice.

Netflix - Crushed earnings, but now what?!NASDAQ:NFLX
When do we sell? Where are we going?
Netflix crushed recent earnings and have a ton of momentum behind them. I believe this is where we are going...
🎯$1033🎯1107
Not financial advice

Netflix (NFLX): Explosive growth, but caution aheadNetflix ( NASDAQ:NFLX ) is set to open 14% higher after adding a record-breaking 18.9 million subscribers in Q4—nearly double Wall Street’s expectations and well above the early 2020 peak of 15.8 million. These incredible numbers have sparked a strong market reaction, and the enthusiasm is well-justified.
Following this update, we’ve re-evaluated the chart. While we anticipate the potential for more upside, it’s unlikely that NASDAQ:NFLX will continue climbing without a significant correction at some point. The trendline since May 2022 has proven its importance, serving as resistance nine times before being flipped into support and holding firm on a key retest.
Currently, Netflix is approaching the significant psychological level of $1,000. If this level is reclaimed, a further push toward $1,070 and even $1,300 could materialize. However, we’re exercising caution as major levels and target zones have already been achieved. There is a chance—albeit slim—that today’s earnings gap could mark the top of wave ((v)) and wave 3.
For now, we’re waiting for further developments and will decide our next steps as the stock’s trajectory becomes clearer. Stay tuned for updates.

NETFLIX New Bullish Leg to $1140 has started.Netflix (NFLX) has been trading within a long-term Channel Up since the October 18 2023 Low. Every time that the price broke below and later recovered the 1D MA50 (blue trend-line), it was the most efficient buy signal of the pattern.
This is what took place yesterday, we had the first recovery above the 1D MA50 since the break below it on Jan 10. Along with the inevitable Bullish Cross below the 0.0 level on the 1D MACD (which again has been the best buy signal all these years), we expect the new technical Bullish Leg of the Channel Up to start.
So far we've had 5 core Bullish Legs and as you can see the tend to rise by roughly the same amount two at a time. The first two have been roughly +40%, then the next two +25% and the one before +38.71%. It is fair to assume that the one that has just started will be of around +38.71% too. As a result, we can place our Target a little lower for less risk and aim at $1100.
-------------------------------------------------------------------------------
** Please LIKE 👍, FOLLOW ✅, SHARE 🙌 and COMMENT ✍ if you enjoy this idea! Also share your ideas and charts in the comments section below! This is best way to keep it relevant, support us, keep the content here free and allow the idea to reach as many people as possible. **
-------------------------------------------------------------------------------
💸💸💸💸💸💸
👇 👇 👇 👇 👇 👇

Netflix Stock Up 14% Premarket Following Record-Breaking QuarterNetflix Inc. ( NASDAQ:NFLX ) is making headlines with a significant 14% surge in premarket trading, fueled by the company’s record-breaking fourth-quarter performance. This milestone, driven by live sports programming and the return of its flagship series, *Squid Game*, marks a pivotal moment for the streaming giant. Here’s an in-depth look at the technical and fundamental aspects behind this remarkable rally.
Record Subscriber Growth
Netflix added an unprecedented 18.9 million subscribers in Q4 2024, bringing its global subscriber base to over 300 million. This growth, more than double Wall Street’s expectations, surpasses the company’s previous record of 15 million new subscribers in Q1 2020. Notably, this quarter marked the final time Netflix will report subscriber numbers, signaling a shift toward emphasizing financial metrics such as revenue and profit.
Revenue and Profit Surge
Netflix reported a 16% year-over-year increase in revenue, reaching $10.2 billion for the quarter—its most substantial growth since 2021. For 2025, the company projects revenue of up to $44.5 billion, a 14% increase, with an operating margin of 29%. These robust financials underscore the company’s ability to sustain growth amidst a competitive streaming landscape.
Key Drivers of Growth
1. Live Programming: Netflix’s venture into live sports, including its first major National Football League games and the Jake Paul vs. Mike Tyson boxing match, has proven to be a game-changer. These events attracted record sign-ups, highlighting the potential of live programming to drive subscriber growth.
2. Content Strategy: The return of Squid Game and the success of the hit movie Carry-On further bolstered subscriber numbers. Netflix’s diverse programming mix ensures broad audience appeal, while no single title dominated subscriber additions.
3. Password Sharing Crackdown: The company’s crackdown on password sharing contributed to its best-ever year for subscriber growth, with 41 million new customers added in 2024.
4. Advertising Revenue: While still in its early stages, Netflix’s advertising business is gaining traction. A majority of new subscribers in markets with ad-supported tiers opted for this model, signaling growing acceptance of ad-supported streaming.
Price Increases
Netflix is boosting prices across several markets, including the U.S., Canada, Portugal, and Argentina. The most popular U.S. plan now costs $17.99 per month, a $2.50 increase. These price hikes are expected to contribute significantly to revenue growth in 2025.
Market Reaction
Netflix shares closed at $869.68 in New York on Tuesday and are set to open with a 14% gain in premarket trading. If sustained, this would mark the stock’s most significant gain since October 2023.
Technical Analysis
As of premarket trading, NASDAQ:NFLX is up 14.70%, reflecting bullish sentiment driven by the record-breaking quarterly performance. The Relative Strength Index (RSI) was at 48.99 before this surge, indicating the stock was neither overbought nor oversold.
Bullish Gap-Up Pattern
The premarket rally sets the stage for a potential gap-up pattern at market open. This technical phenomenon occurs when a stock’s opening price is significantly higher than its previous closing price. Historically, gap-ups are strong bullish indicators, often followed by brief pullbacks as traders digest the news.
Resistance and Support Levels
- Resistance: The stock is eyeing its one-month high as the next resistance level. A breakout above this point could trigger further bullish momentum.
- Support: Immediate support lies at the $776 level. A breakdown below this level could lead to a retest of lower support zones, but this scenario appears less likely given the current bullish momentum.
Market Outlook
With the broader stock market expected to rally following Donald Trump’s inauguration earlier this week, NASDAQ:NFLX is poised to capitalize on favorable market conditions. The combination of strong fundamentals and bullish technical indicators suggests a continued upward trajectory in the near term.
Conclusion
Netflix’s record-breaking quarter underscores its resilience and adaptability in an evolving streaming landscape. The company’s strategic focus on live programming, diverse content offerings, and advertising is paying off, driving subscriber growth and revenue to new heights. From a technical perspective, the stock’s premarket surge and bullish patterns point to a strong start for 2025.
As Netflix pivots toward prioritizing financial metrics over subscriber numbers, investors have much to look forward to in terms of sustained growth and profitability. With NASDAQ:NFLX setting the stage for a historic year, the streaming giant remains a compelling investment opportunity for traders and long-term investors alike.

Netflix (NFLX) AnalysisNetflix recently experienced a pullback, dropping to a significant demand zone around $820-$850, which has historically acted as strong support. This drop has attracted traders eager to capitalize on the current discounted price, anticipating a potential bullish rebound.
Looking at the chart:
1️⃣ Previous Earnings Reaction: The last earnings report sparked a 12% spike, showcasing Netflix’s potential for strong momentum following positive results.
2️⃣ Demand Zone Support: The stock is consolidating around this key level, indicating that buyers are stepping in to defend it.
3️⃣ Bullish Expectations: Traders are positioning themselves for the upcoming earnings report, expected on 01/21/2025 after market close, which could act as a major catalyst for upward movement.
If the earnings report meets or exceeds expectations, we could see Netflix rally toward all-time highs, with the first resistance zone around $940 and a longer-term target of $1,020.

NETFLIX: I want to enter!! When to enter??The question we all ask ourselves in companies with a similar graphic appearance to Netflix is:
--> I WANT TO ENTER!! WHEN TO ENTER?
We are all eager to get into Netflix. No one wants to miss out on the gains that could accumulate during 2025, but one of the factors to consider, and for that, YOU MUST BE VERY CALM, is PATIENCE.
That is to say, when the price is in a retracement phase, as is the case with Netflix, no one is a fortune teller to know when it will end. We can identify important support areas, but nobody knows with 100% certainty if they will be broken down, or conversely, if they will be the turning point for a new upward impulse.
--> What point is Netflix at now?
If we look at the H4 chart, the trend is still clearly bullish, but the price is in a retracement phase. The area it is currently in is the first important support zone; that is, IF THIS AREA HOLDS, and the price BREAKS ABOVE THE RED TREND LINE on the chart, we would get the first bullish signal (Bull), and it would be the start of a new upward impulse towards new highs. But for now, we need to wait for the price to indicate a turn upwards because if we enter now, it could lose support and continue to decline.
--> SUMMARY
PATIENCE and waiting for the chart to show us an upward turn (Bull). When this happens, I will publish an analysis with the ENTRY SETUP again.

NETFLIX: testing the 1D MA50. Buy?Netflix is marginally bearish on its 1D technical outlook (RSI = 43.757, MACD = 4.950, ADX = 42.375) as the December correction is testing now the 1D MA50. Technically this has been the trend's support since mid August 2024. The 2 year Channel Up offers useful conclusions here. Each of its past January months (2023 and 2024) saw a surge of +38% from their closest low. If this is repeated again, then the price will test the Channel's top. Aim for that +38% rise (TP = 1,200).
## If you like our free content follow our profile to get more daily ideas. ##
## Comments and likes are greatly appreciated. ##

NFLX Elliot Wave, Wyckoff Method with Head & Shoulders PatternIt is not always easy to time a short, but looking at this chart I will share a couple of confluences that are interesting from a technical analysis point of view.
First, there is a 5 wave completion of the Elliot Wave pattern.
Then, based on the Wyckoff method of accumulation to distribution, we can gauge areas of UTAD and LPSY takes place.
Lastly, we can form a Head & Shoulders pattern (a small one) and a neckline.
One can carefully enter the short after the break and retest of the trendline, which is the safest way.

$ICP to $90ICP to $90
CRYPTOCAP:ICP made an appearance on the netflix show inside job 🤡
CRYPTOCAP:ICP will go to $1000 this cycle

Netflix Analysis: Key Levels and Trading Outlook 2024.12.29Hello, this is Greedy All-Day.
Today’s analysis focuses on Netflix (NFLX).
Weekly Chart Analysis
Looking at the weekly chart, Netflix is currently consolidating within the 884–944 range, which represents about a 5% range of sideways movement. This consolidation has lasted for approximately one month.
Since the sharp decline in 2022, Netflix has been following a newly established ascending trendline, which remains intact and shows no signs of breaking.
Key observations:
Netflix has climbed approximately 35% beyond its all-time high in 2021, reaching new highs.
However, the price is now in a consolidation phase, which raises the question: is Netflix preparing for further upside, or is this a period of rest before a potential pullback?
If this sideways movement continues for an extended period, a trendline breakdown may occur. Based on current prices, this breakdown is projected around July 2025.
Weekly Chart with Indicators
When we include indicators such as the 60 EMA, we notice that it aligns closely with the ascending trendline. This alignment increases the reliability of the trendline as a key support level.
However, at this point, entering a new long position appears less attractive due to the following reasons:
Netflix has already risen 35% beyond its previous high of $700, making it difficult to justify additional upside based solely on past data.
Without historical data to support further gains, investors would likely rely on fundamental analysis and the belief that Netflix is undervalued as a company.
Ideal Buy Zones
Where are the best entry points for a buy position?
While Netflix’s current uptrend may suggest continuous growth, corrections are inevitable, even for large companies. Based on this, I’ve identified two potential buy zones marked as blue boxes on the chart:
First Buy Zone: $700
This level was the all-time high in 2021, which now acts as support after being broken to the upside.
Even if the price drops, it’s unlikely to fall below $700 easily, as this level is supported by the ascending trendline from 2022.
Second Buy Zone: $350
The first green box shows a sharp drop followed by a temporary rebound.
The second green box highlights a key support level that held during a previous consolidation phase. Both zones indicate strong support and potential for a bounce.
Reversal and Sell Perspective
The red box zone highlights an area for potential reversal or sell positions.
If Netflix breaks the $700 level and the ascending trendline, it would signal a significant shift toward a bearish trend.
A breakdown below $700 could lead to a sharp decline, with the first buy zone ($700) and second buy zone ($350) representing a potential 50% difference.
This suggests that a trendline breakdown could trigger a substantial bearish reversal, making short positions or hedge strategies worth considering.
Conclusion
While Netflix has demonstrated strong upward momentum, history shows that even the largest companies can experience corrections of 70% or more.
Instead of chasing continuous rallies, it’s crucial to consider both bullish and bearish scenarios and plan trades accordingly.
Let’s make 2025 a successful trading year together. 🚀

GOOD BTC ENTRY !! SL 59K TP 72KREASONS WHY !!
Market Sentiment and Momentum:
Bitcoin soared in 2023, and experts predict further gains in 2024, potentially reaching $80,000.
Despite long-term optimism, Bitcoin experienced a recent dip.
Technical indicators suggest potential downside, but the market remains in a tug-of-war.
If buyers can push past the $44,700 resistance, a jump to $48,000 is in sight.
Spot Bitcoin ETF Launch:
The launch of a spot Bitcoin ETF in early 2024 is poised to revolutionize the crypto landscape.
This move is expected to attract significant capital from both retail and institutional investors, further fueling Bitcoin’s ascent.
Bitcoin Halving Event:
Scheduled for April or May 2024, the Bitcoin halving event will curtail the yearly supply of new Bitcoin.
This reduction in supply could establish conditions where demand potentially outstrips supply, a fundamental factor in the optimistic price forecast.
Investor Confidence and Accumulation:
Investors are holding on to their BTC with conviction stronger than in 2021.
Relative realized profits show that despite a new all-time high, selling has not been as significant as during the previous cycle.
Consistent accumulation since February 2024 indicates confidence among investors, expecting further price growth.
