Netflix

NETFLIX, for the win!They practically can't do anything wrong, perfect positioning of the company considering the current times we're living in.
There are just 20 days before their quarterly report, so you should keep an eye on this one, by my estimation, it will reach at least a 540 in this time-frame.
It seems that I wasn't paying proper attention to this stock, and I missed a better entrance, as I started a position at 493.5. Tomorrow's unemployment numbers might offer be a better opportunity. My recommendation is a definite buy (and dump 1 day before the QR, I got a bit burned last year with Netflix). Buy today or tomorrow if it drops, either way, it is in the buying zone right now.


Netflix - going up from supportUpdate on my previous idea - Netflix is bouncing back from support.
You can find my previous idea here:

NETFLIX buy opportunityNETFLIX is another pandemic winner
It has reached bottom at this level
Only buy at this point
Happy trading and thanks for the likes

Elliott Wave View: Rally in Netflix is Expected to FailElliott Wave view of Netflix (NFLX) suggests the stock is doing a double three correction from September 2 high. Down from September 2 high, wave (W) at 478.84 low. The subdivision unfolded at a zigzag correction, where wave A ended at 485.98 low, wave B ended at 522 high, and wave C ended at 478.84 low. Afterwards, the stock bounced higher in wave (X). The subdivision of the bounce unfolded as an expanded flat correction. Up from wave (W) low, wave A ended at 493.73 high. Wave B dip ended at 471.30 low. The push higher in wave C ended at 504.77 high, which also ended wave (X) in the higher degree.
Since then, the stock has resumed lower and broken below previous wave (W), confirming the next leg lower in wave (Y) has started. Down from wave (X), wave A ended at 463.27 low. The bounce in wave B unfolded as another expanded flat and ended at 492.37 high. Currently, wave C is in progress. Wave ((i)) of C ended at 465 low. The bounce in wave ((ii)) is still unfolding as zigzag correction. While below 504.77 high, expect the bounces in 3, 7, or 11 swing to fail for more downside in the near term. The 100-123.6% extension of wave A-B where C can potentially ends is at 441.36-451.13.

Netflix - bouncing back from supportWe can see than Netflix has reached support zone (465- 470) - and ar going up from there to resistance and upper range zone.
Good chance to get long position. Stop loss should be below support, take profit - around resistance zone.

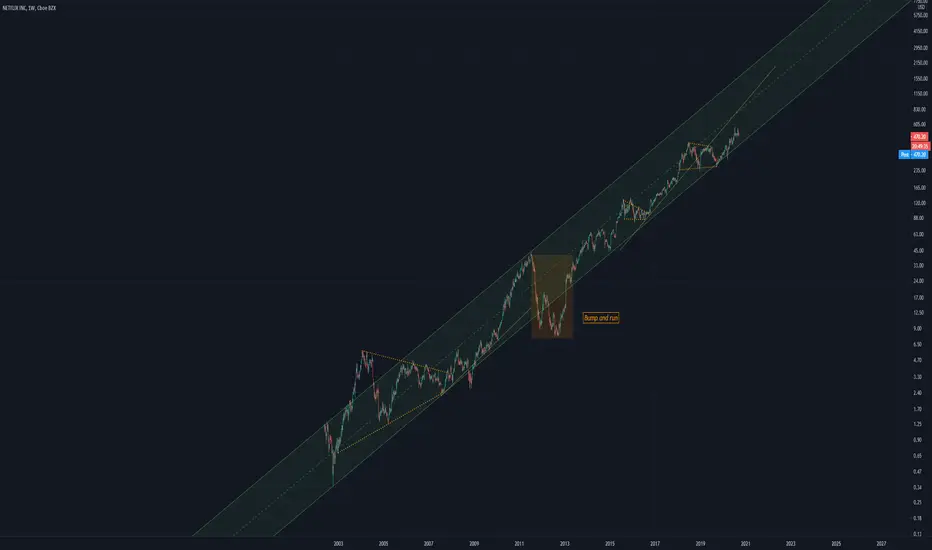
Born within a Bubble NFLXBorn during the tech bubble in 01
It makes sense that active users of Netflix would increase during quarantine
Hence I am labelling this a buy
Long term channel intact
LONG NETFLIXWe have a strong up trend in the company, right now the stock is at a make it or break it situation, we buy at the bottom of a consolidation hoping to exit the trade at a price near the 561 level. If the support doesnt hold, we can sell the stock until the next important level 420-400.

Chek ATS at Tesla and other stockLet's take a look at a few real market stocks and the way they interact with the ATS.
*Based on new beta version ATS
The release will be next week
⬇️ A few more screenshots below ⬇️
-Amazon
-Nvidia
-Netflix
-Beyond meat

Netflix - what has happenedSince Netflix is stirring up controversy (who and what doesn't) I thought I would give some perspective.

Time to move stoplossWith this position opening at $517. I think moving stop loss to $510 is best for risk management. I don't think this stock will close above $500 physiological level. With trailing stop loss placed this position should be fixed in profit. Both MACD and RSI look like this is just going to continue downwards.

FANG+ Index: All US Fang Stocks Likely ToppedHello traders,
The NYSE FANG+ Index, which constitutes: Tesla, Nvidia, Alibaba, Baidu, Twitter, Facebook, Apple, Amazon, Netflix and Alphabet, have in my work, topped. In particular, those of which are US-born names. Some may get closer to their current ATHs than others, and others may consolidate in a B wave more than others, but overall as a general trend, many of them have reached their complete and total top.
A lot of people were angry at my Tesla call where I accurately predicted that the top was reached and it will begin to crash - this deemed to be correct and spot on. Since then, many people on TradingView have copied my Tesla chart almost identically with different colours now that they have already seen a significant demise in the technicals of the stock.
This is not the time to be taking risk and artificially believing large-cap US tech can "go up forever" otherwise you will get burned in the next half year and several years beyond.
Trade large-cap tech with extreme caution. This risk is not just limited to FANG stocks - but also - stocks like Peleton, that have soaring valuations; that are totally unrealistic, unsustainable and unachievable.
-zSplit

NFLX looks like 414 is a 50% of last impulse, Head and Shoulders can be useful pattern for short sellers

Over pricedIf the stock market does see a reversal Netflix appears to be one of the best stock fundamentally to short. It's sitting with a P/E over 80. The company has main stream adoption and dominance in their market. The issue with being the largest in an industry is unless that industry keeps growing you can't. They are valued like a growth stock without a high growth small cap narrative to justify it and they have increasing competition.
On the technical side a retracement to 200 daily MA is very possible if the market see's a correction. MACD is signaling a change of direction on the stock. RSI have lots of room to move down.
Price: 517
Stop loss: 550
Take Profit: 400


THE NETFLIX STOCK going up the next daysmore potential the Netflix stock going up so the stock can reach more 560 prices

Long Term investment on Netflix NFLX- Weekly chart
- has broken long term rectangular which started June 2018
- made back test at $424 and got strong support
- price is bullish on 10 EMA + 40 EMA
- MACD is bullish
- long term investment with expected ROI %20 in 6 months
What do you think ?
Please read this first !
This post does not provide financial advice. It is for educational purposes only! You can use the information from the post to make your own trading plan for the market. But you must do your own research and use it as the priority. Trading is risky, and it is not suitable for everyone. Only you can be responsible for your trading.
Regards


NFLX LONG SET UP (NETFLIX)TITLE/(DATE)- BUY NFLX/USD
ASSET- STOCK
PLATFORM-MT4
ORDER TYPE- BUY Market
Time Frame-4hr
ENTRY PRICE 1- $475.50 ✅ market
ENTRY 2- $468.50
STOP LOSS- $465.50(100 PIPs)
TAKE PROFIT 1-$485.50 (100PIPS)
TAKE PROFIT 2- $495.50(200 PIPS)
TAKE PROFIT 3- $505.50 (300 PIPS)
TAKE PROFIT 4- $525.50 (500 PIPS)
TAKE PROFIT 5- $545.60 (700 PIPS)
STATUS: Active

NFLX Trade Update, bullish triangle completedNFLX is setting up for a wave (v) increase into the 655-660 upside target. Wave v rally in progress as the current bullish triangle pattern has been completed yesterday. If this is the case bulls are setting up targeting the potential 760-770 wave v upside target. Check video update on trade management and profit maximization on NFLX existing bullish vertical spreads.
