Netflix's Shorting Potential Slipped Away by a Mere Two DaysMissed the Mark: Netflix's Late Entry Foils My Shorting Plan, and Now It's Breaking Bullish Boundaries!
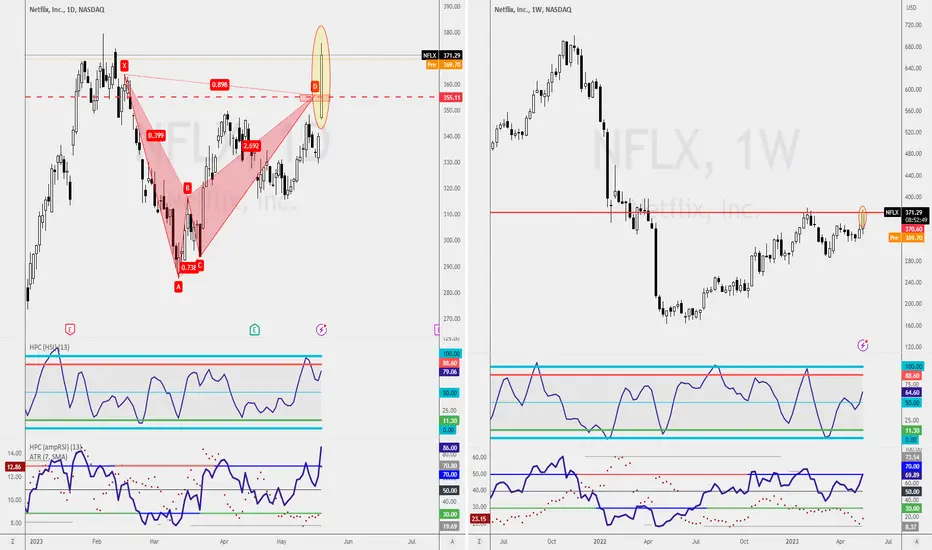
Oh, the frustrations of timing! Just two days too late, Netflix seems to be defying my expectations. It's now poised for a structural breakout, potentially closing above the X point of my carefully identified Bearish Bat Pattern.
While this turn of events may be advantageous for Netflix, discouraging more traders from shorting, it's a letdown for me after patiently awaiting this setup for weeks.
But hey, that's the nature of trading. Time to swipe left on this missed opportunity and patiently await the next promising setup.
That said, the weekly resistance level holds(right).
Netflix
Netflix NFLX Next MovePair : NFLX ( Netflix )
Description :
Bearish Channel in Long Time Frame as an Corrective Pattern with the Breakout of the Lower Trend Line and Retracement
Break of Structure
RSI - Divergence
Completed " ABC " Corrective Wave
Bearish Channel in STF with the Breakout of the UTL need to wait until it Completed its Retest
Impulse Correction Impulse

$NFLX - bull and bear thesisNASDAQ:NFLX
Daily timeframe
* At the end of this triangle, ready to bust a move
Bull: A move back to $373, if breakout
Bear: A move back to $282, if breakdown

NFLX - Double TopA double top pattern which is considered bearish
This double top formed at a location of strong resistance
Daily chart

Netflix to the Upside 4/30/23I think Netflix is going to the upside tomorrow. the market may pull back slightly but after that ill be looking for a setup to take Netflix long. NASDAQ:NFLX

What Happened With NFLX Today?We experienced some increased momentum today, so what's the fuss all about? Let's discuss the upcoming and trending news with Netflix this month.

Netflix head and shoulders!A premature bearish pattern is forming, risky to get short now but reward would be large. Good luck!

Netflix dumps and pumps after earningsYesterday, after the market close, Netflix reported its earnings for the 1st quarter of 2023. The tech giant missed analysts’ expectations, resulting in a quick and sharp selloff of nearly 12%. However, this move lasted only three minutes before the price started reversing to the upside. Within the next hour, shares erased all of their early losses.
The company posted $1.305 billion in net income, showing a decline of 18.3% YoY (in 4Q22, Netflix reported a net income of only $55.284 million). Revenue stood at $8.161 billion, up approximately 3.7% YoY and 4% QoQ. Operating income fell by 13% YoY. In addition to that, the average paid memberships rose by 4% YoY, with the company reaching 232.50 million global streaming paid memberships.
In 1Q23, Netflix launched paid sharing in four countries, and in the second quarter of 2023, the company plans to expand this service into more countries, including the USA. Furthermore, Netflix seeks to improve its revenue from advertisements and currency operations. For 2Q23, Netflix forecasts revenue of $8.2 billion, representing a 3% increase YoY. The company also expects to return $1.6 billion in operating income for the same period. Netflix shares are up approximately 105% since their low in May 2022 and about 16.5% year-to-date.
Other important information
The company’s operating income declined for four consecutive months in 2022 - 1.972$ billion in 1Q22, 1.578$ billion in 2Q22, 1.533$ billion in 3Q22, and 550$ million in 4Q22. The same applies to the net income in 2022 - 1.597$ in 1Q22, 1.441$ billion in 2Q22, 1.398$ billion in 3Q22, and 55$ million in 4Q22. In the first quarter of 2023, Netflix saw a significant rebound in both of these metrics.
Illustration 1.01
Illustration 1.01 portrays the 1-minute chart of Netflix stock. The yellow arrow indicates market close, which coincided with the release of the company’s financial results. Within the first three minutes following the announcement, shares dropped nearly 12% before erasing all losses.
Illustration 1.02
Illustration 1.02 displays the daily chart of Netflix stock. Yellow arrows indicate previous earnings, which were accompanied by a similar negative reaction in the price of shares.
Please feel free to express your ideas and thoughts in the comment section.
DISCLAIMER: This analysis is not intended to encourage any buying or selling of any particular securities. Furthermore, it should not be a basis for taking any trade action by an individual investor. Therefore, your own due diligence is highly advised before entering a trade.

I think NFLX is a sell NFLX although beating estimates, I feel like a short term sell off is about to happen. I have been analyzing earnings and from my analysis, I’ll be shorting NFLX for awhile here


$NFLX 4/6/23 | Netflix 355 PutsNetflix Trade 4/6/2023
335 Puts SAMe day Expiration
$1.77 entry 9:39pm - $2.58 exit at 9:44am
5 minutes = $81.00
Pros
1.Charting the day before allowed me to take advantage of the oppurtunity. knowing where the danger zones were gave me comfort.
2.I also manage my fear of loosing, and greed very well.
3.I leran that Direction and Momentum is everything.
4.I allowed my indicators to confirm the direction
Cons
1.No stop Loss, this is a hudge problem for me. im going to study this weekend. how to emplement a stop loss on Trade Station Mobile.
Notes
1.Its not good to try to catch bounces at the open of the market.
the amount of selling pressure will push through the zone.
2. Place your trading notes on your charts,
3. Only trade what you chart.

Netflix: Bringing It on Stream 🎞Netflix has brought wave b in magenta on stream quite commendably and has already touched at the gray zone between $343.40 and $359.13. Thus, wave b in magenta could be finished by now, although the share could just as well use the remaining room in the upper part of the gray zone to place the corresponding high. As soon as this is done, the course should turn and head for the turquoise zone between $271.07 and $209.09 to develop wave B in turquoise. Afterward, Netflix should tackle the resistance at $379.43, which should then be conquered by wave C in turquoise. However, we should still keep in mind the 35% chance that the stock could break through the turquoise zone and drop below the support at $162.75.

Netflix (NFLX) Looking to Complete 5 Waves Elliott Wave ImpulseCycle from 3.13.2023 low in Netflix (NFLX) is in progress as a 5 waves Elliott Wave impulse. Up from 3.13.2023 low, wave 1 ended at 316.6 and pullback in wave 2 ended at 293.21. As the 45 minutes chart below shows, internal of wave 2 unfolded as a double three structure. Down from wave 1, wave ((w)) ended at 296, wave ((x)) ended at 307.92, and wave ((y)) lower ended at 293.18. The stock then extended higher in wave 3 towards 336.44 with internal subdivision as 5 waves in lesser degree. Up from wave 2, wave ((i)) ended at 302.91 and dips in wave ((ii)) ended at 300.56. The stock extended higher in wave ((iii)) towards 322.78 and dips in wave ((iv)) ended at 312.15. Final leg higher wave ((v)) ended at 336.44 which completed wave 3.
Pullback in wave 4 ended at 321.28 as a zigzag structure. Down from wave 3, wave ((a)) ended at 324.41, wave ((b)) ended at 333.32, and wave ((c)) lower ended at 321.28. This completed wave 4 in larger degree. The stock resumes higher in wave 5 with internal subdivision as another 5 waves. Up from wave 4, wave ((i)) ended at 329.89 and wave ((ii)) ended at 325.84. Wave ((iii)) ended at 343.29, pullback in wave ((iv)) ended at 335.30. Expect stock to extend higher 1 more leg to end wave ((v)) of 5 of (A). Then it should pullback in wave (B) to correct cycle from 3.13.2023 low in larger degree 3, 7, or 11 swing before it resumes higher again.

Netflix and Crash?Price has been on a steady uptrend since the beginning of July 2022. Looking at higher timeframe charts we can see price forming a head and shoulders around the $333 zone which could signal a reversal coming soon given if there's enough downward momentum. If price breaks above the $333 zone, this head and shoulders pattern would be considered a failure. We'll see what happens in the next coming days and react to what the charts show us!

Monday Trade RecapDid you trade using the strategy i shared with you
yesterday?
-
-
How did the trade go?
-
-
In this video I share with you the problems and worst-case scenario
that you could have potentially faced using
-
-
The trading strategy i showed you yesterday
-
-
Watch it now to find out
the problems and challenges you may potentially face.

Netflix Netflix, after finding support just above the .786 fib from the previous analysis in January 2021, it has had a nice bounce into .618 resistance, looks like an area to be cautious at, breakdown looking at $320/$280 as support. If it can close above $369.30 target would be $440/$454

NETFLIX This price jump will be huge and can reach $490.Netflix (NFLX) has gone a long way since we called the exact bottom back on our April analysis:
Since then, the stock has formed a well structured Bullish Megaphone pattern, which is currently rising after almost touching its bottom. The 1D MA50 is the short-term Resistance and the 1W MA100 (red trend-line) the long-term. A break above it can see NFLX's biggest swing since the recovery that has the capacity to extend as high as the 0.618 Fibonacci retracement level and make a Megaphone Higher High at $490.00.
-------------------------------------------------------------------------------
** Please LIKE 👍, FOLLOW ✅, SHARE 🙌 and COMMENT ✍ if you enjoy this idea! Also share your ideas and charts in the comments section below! **
-------------------------------------------------------------------------------
💸💸💸💸💸💸
👇 👇 👇 👇 👇 👇

VIVENDI has an excellent control of Net debt to EBITDAFUNDAMENTAL
Very good fundamental results. Net debt to EBITDA ratio x0.99, EBITDA +35.6% increase YoY. Even though Canal+ business has Netflix and HBO as biggest competitors, Gameloft investment was a smartmove from Vivendi, as well as Lagardere. Deconsolidation of Telecom Italia damaged shareholders' attributable earnings up to -€1bn.
I still need to get informed about the company's wish to sell Editis. But overall, positive on the stock.
TECHNICAL
After US's and Switzerland's banking crisis, Vivendi has touched the 0.5 Fibonacci Level almost 3 times. The stock is immersed in a long-term downward trend that started back in August 2021. A superation of the downward channel could mean a turnaround for the long-term trend. 9.50€ level (0.236 Fibonacci) could be one of the first levels for Vivendi to reach in the near term.

NFLX 1WWhy do I expect price to move lower towards 223 USD?
Firstly, let's look at the chart.
What can you can read from the chart?
Price has moved sharply up after correction testing fib 0.382.
Price has also tested weekly PoC (very strong resistence).
Price is currently below Ichimoku Cloud (strong resistence).
What do I expect will happen based on my readings?
I believe price will move back towards local PoC around 223 USD while breaking local trend line.

Netflix - SHORT (54% profit) / where to buy (NEW)In May 2022 Netflix has hit lows seen last time in September 2017.
Since then NFLX has been on a steady rise. It looks like the price is in some kind of a rising channel.
Indicators such as MACD or RSI are implying more upside in the next weeks. It looks good for bulls. Around $380 we may see a rejection as it's a huge resistance now. We expect bears to take over from there and the downtrend to resume. If the price drops 54 % from there we could see a potential higher low /double bottom which would be mega bullish and would help bulls to confirm the long-term uptrend.
-Short at the strong resistance
-exit for shorts / buy area: $177 - $170
Most likely it will take many months for a price to reach a buy area therefore patience is required .
Good luck

Netflix price movements repeats itselfThis is how I see Netflix, we're seen these moves happen several times.
I expect the price to move down before we continue up.

NYSE FANG+ Index: wait is better⌛' The NYSE FANG+ Index is a rules-based, equal-weighted equity benchmark designed to track
the performance of 10 highly-traded growth stocks of technology and tech-enabled companies in the
technology, media & communications and consumer discretionary sectors'.
Companies included in the index:
Meta, Apple, Amazon, Netflix, Microsoft, Google, Tesla, NVIDIA, Snowflake and Advanced Micro Devices.
Graphically speaking, I would expect a better definition of which way the price is going.
Looking at the Stochastic Momentum Index, I would say that opening a long position would be too risky.
Below are some possible scenarios:
Scenario 1:
Scenario 2:
Scenario 3:
Scenario 4:
Scenario 5:

NETFLIX AND SMASH?Netflix is currently sitting on an upward trendline, there are only two options for where this could go. I see this trendline bounce failing and a downward trend starting but we'll see how the markets react on Monday. Have a great weekend everyone!!
