Was the NFLX sell-off predictable???Of course it was! You could have sold the head and shoulders bearish chart pattern back in November, before Jim Cramer said NFLX is a buy! :)
My forecast is that NFLX will make a small bounce before going even lower, at a buy area of $175 - 190.
Looking forward to read your opinion about it.
Netflixforecast

Netflix Analysis 11.02.2022Hello Traders,
welcome to this free and educational analysis.
I am going to explain where I think this asset is going to go over the next few days and weeks and where I would look for trading opportunities.
If you have any questions or suggestions which asset I should analyse tomorrow, please leave a comment below.
I will personally reply to every single comment!
If you enjoyed this analysis, I would definitely appreciate it, if you smash that like button and maybe consider following my channel.
Thank you for watching and I will see you tomorrow!

NETFLIX CRASH 2022Hi there,
Netflix has seen CRASH and it bounce back but lost momentum. As you can see on the CHART.
NETFLIX may go to MAJOR SUPPORT LEVEL DOWN DOWN DOWN
Kind regards

Netflix: Great opportunity to buy the dipAfter a huge gap, investors such as Bill Ackman even the CEO of Netflix are buying the dip in this strong support line in all extreme oversold levels. We expect the price to recover if there are no bigger corrections on the main indices. Netflix is experiencing less growth due to higher competition but the company still has good numbers. It's a buy and hold.

Netflix Analysis, The Entry into The Gaming Sector Hello everyone, as we all know the market action discounts everything :)
_________________________________Make sure to Like and Follow if you like the idea_________________________________
The market seems to be falling into a small sideways move for the last 10 days that's located between the ranges of 610.13 and 572.07.
NFLX has been doing great for itself, in the last month the stock jumped from 504.75 up to 615.75 that's a 22% increase which is huge and both the long and short-term trends are positive.
NFLX has an average volume of 3244020. This is a good sign as it is always nice to have a liquid stock.
Possible Scenarios for the market :
Scenario 1 :
The market is trading at 599.06 and it's crossed the first resistance located at 595.54 and it looks that it could be headed to the main resistance zone near the 607.23 area
If the market was able to breakout that zone we will be seeing a breakout of that sideways move that could lead the price to a new all-time high at the range of 636.36.
Scenario 2 :
In case the market continues his sideways move, we could see the price drop to the lower end of the channel near the 576.41 level and bounce back up after a battle over control between the Bears and Bulls with the winner most likely to be the Bulls.
The market will probably trade in the channel range for a while before reaching the resistance zone at 607.23 and breaking out of it.
Technical indicators show :
1) The market is above the 5 10 20 50 100 and 200 MA and EMA (Strong Bullish sign)
2) The RSI is at 62.54 showing Great strength in the market, IF the RSI drops from here it will Create a divergence with the market.
3) The ADX is at 33.01 Showing that the market is trending with a positive crossover between DI+ (27.21) and DI- (14.41)
Daily Support & Resistance points :
support Resistance
1) 576.16 1) 595.54
2) 568.47 2) 607.23
3) 556.79 3) 614.92
Weekly Support & Resistance points :
support Resistance
1) 573.88 1) 605.12
2) 555.36 2) 617.84
3) 542.64 3) 636.36
Fundamental point of view :
Netflix Completes The Acquisition of Night School........
for those who don't know Netflix has announced that it has completed the acquisition of Night School. The gaming studio is known for developing games and is behind the popular game Oxenfree.
This new project will provide Netflix with a lot of Value now that its steeping into the Gaming sector.
The VP added that Netflix is dedicated to building the creative capabilities and library of Netflix games with Night School. He added that Netflix intends to introduce exclusive games designed for various categories of gamers. The games will be included with its membership, and users will get to enjoy them with no ads or in-app purchases.
NFLX has a Return On Assets of 10.72%. This is amongst the best returns in the industry. The industry average is -3.91%. NFLX outperforms 90% of its industry peers.
NFLX's low PEG Ratio, which compensates the Price/Earnings for growth, indicates a rather cheap valuation of the company which could indicate a big increase in the stock price in the near future.
This is my personal opinion done with technical analysis of the market price and research online from Fundamental Analysts and News for The Fundamental point of view, not financial advice.
If you have any questions please ask and have a great day !!
Thank you for reading.

Netflix Analysis, A breakout is near Hello everyone, as we all know the market action discounts everything :)
_________________________________Make sure to Like and Follow if you like the idea_________________________________
The Netflix stock price is still trending in a sideways channel between the ranges of 478.73 and 565.39, the side movement of the trend is still not broken and the market is trending in the middle range of the channel, Note that the Major trend is still bullish for the stock with no major reversal signs yet.
We could be seeing a movement in the current trend in the next period of time which could affect the major trend, but a confirmation and a breakout is needed to say that the trend has changed.
Talking about a lower time frame, On the daily basis we are looking at 2 different Scenarios in the next few days :
Scenario 1 :
after a Bullish Harami pattern has emerged in the market, the price will most likely move up and hit the first resistance level at 529.81, if the Bulls were able to hold control then the price will keep going up and will be headed to the resistance line at 551.28 which would bring the Stock price to near the high edge of the channel where we could be seeing a Bullish breakout for the long term trend.
Scenario 2 :
The bears are still in control right now and will try to bring the stock price lower, their first stop would be the first support line at 508.34, where the Bulls will have a chance to regain control, but if the Bears were able to hold that control then we will be seeing the price going even lower and hitting the support line at 486.81 which would bring the stock price near the low edge of the channel where we could be a Bearish breakout for the long term trend.
Technical indicator showing :
1) The Market price for the daily trend is above the 5 10 50 100 200 MA and EMA (Bullish sign)
2) The RSI is at 49.66 showing that the market is in a Neutral state right now, a movement in the price could be up or down.
3) The Stoch is showing a positive crossover between %K and D%, No divergences were found between the indicator and the market. (Bullish sign)
4) The Ultimate Oscillator is at 60.033 and giving a buy signal.
Support & Resistance points :
support Resistance
1) 508.34 1) 529.81
2) 496.12 2) 539.06
3) 486.81 3) 551.28
Fundamental point of view :
A federal judge on Monday said Netflix Inc must face a defamation lawsuit by former Manhattan prosecutor Linda Fairstein over her portrayal as a racist and unethical villain in "When They See Us," a 2019 series about the Central Park Five case.
U.S. District Judge Kevin Castel in Manhattan said Fairstein had plausibly alleged defamation as to five scenes, including that she withheld evidence, coerced confessions and directed a racially discriminatory police roundup of young men in Harlem.
The Earnings Per Share has grown by an impressive 62.73% over the past year. Measured over the past 5 years, NFLX shows a very strong growth in Earnings Per Share. The EPS has been growing by 81.41% on average per year.
The short term is neutral, but the long term trend is still positive. Not much to worry about for now.
NFLX is in better financial health than average in its industry. Its Altman-Z score is much better than the industry average of 2.50. An Altman-Z score of 6.53 indicates that NFLX is not in any danger of bankruptcy at the moment.
This is my personal opinion done with technical analysis of the market price and research online from fundamental analysts for The Fundamental point of view, not financial advice.
If you have any questions please ask and have a great day !!
Thank you for reading.

NETFLIX is going DOWN - NFLX price prediction and entry levelsNFLX stock jump out of the bullish trend. This looks like a good opportunity to open SHORT positions for around $510. Take profit should be set between $460 and $480.
ENTRY LEVELS - LONG NETFLIX:
$468
$435
$395

NETFLIX INC Stock buy opportunity , signal buy NFLX
this market will experience an acceleration upwards signifies an upward trend, it will experience a strong breakout of the VWAP with the high volume that has been recorded and it means that the buyers have entered the markets therefore a buying opportunity.
this situation expresses the wonderful opportunity to buy Netflix
if you agree with me do a like and you liked my analysis liked it and comment for encouragement


NFLX, always a good investment Hello Traders,
As we said in our last analysis of Netflix stock price , Netflix’s stock is showing good performance for long terms investment.
Actually if the stock could break the resistance Max M2, we could see a growth to the resistance Max M2.
However if the stock breaks the support down, we could see a decreasing trend.

Nteflix Analysis for long termAs predicted on our last analysis of the Netflix action, the price made a downward trend, and rebound on the support.
therefore, We expect it to be increasing to reach the max M1.
However, we can expect also that the stock enters a zone of equilibrium.


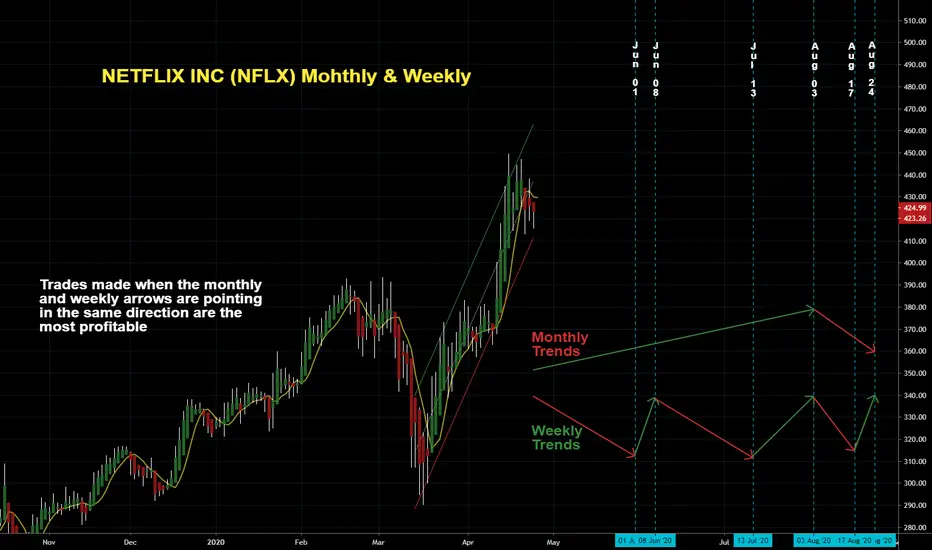
NETFLIX INC (NFLX) Mohthly & WeeklyDates in the future with the greatest probability for a price high or price low.
The Djinn Predictive Indicators are simple mathematical equations. Once an equation is given to Siri the algorithm provides the future price swing date. Djinn Indicators work on all charts, for any asset category and in all time frames. Occasionally a Djinn Predictive Indicator will miss its prediction date by one candlestick. If multiple Djinn prediction dates are missed and are plowed through by same color Henikin Ashi candles the asset is being "reset". The "reset" is complete when Henikin Ashi candles are back in sync with Djinn price high or low prediction dates.
One way the Djinn Indicator is used to enter and exit trades:
For best results trade in the direction of the trend.
The Linear Regression channel is used to determine trend direction. The Linear Regression is set at 2 -2 30.
When a green Henikin Ashi candle intersects with the linear regression upper deviation line (green line) and both indicators intersect with a Djinn prediction date a sell is triggered.
When a red Henikin Ashi candle intersects with the linear regression lower deviation line (red line) and both indicators intersect with a Djinn prediction date a buy is triggered.
This trading strategy works on daily, weekly and Monthly Djinn Predictive charts.
Trades made when the monthly and weekly arrows are pointing in the same direction are the most profitable.
This is not trading advice. Trade at your own risk.