$MTD with a Neutral outlook following its earnings #Stocks The PEAD projected a Neutral outlook for $MTD after a Negative over reaction following its earnings release placing the stock in drift C with an expected accuracy of 100%.
Neutral

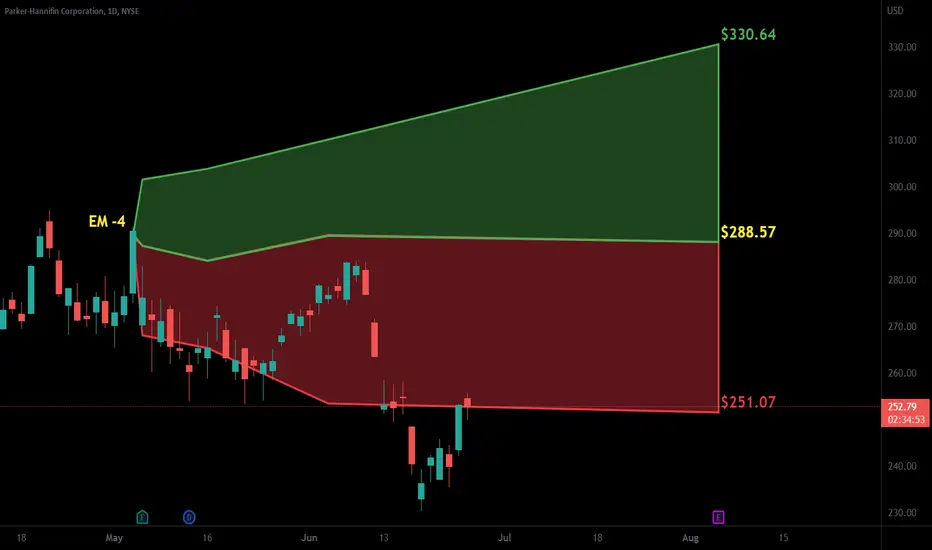
$PH with a Neutral outlook following its earnings #Stocks The PEAD projected a Neutral outlook for $PH after a Negative over reaction following its earnings release placing the stock in drift C with an expected accuracy of 100%.
$PPL with a Neutral outlook following its earnings #Stocks The PEAD projected a Neutral outlook for $PPL after a Negative over reaction following its earnings release placing the stock in drift C with an expected accuracy of 66.67%.

$SRE with a Neutral outlook following its earnings #Stocks The PEAD projected a Neutral outlook for $SRE after a Negative over reaction following its earnings release placing the stock in drift C with an expected accuracy of 66.67%.

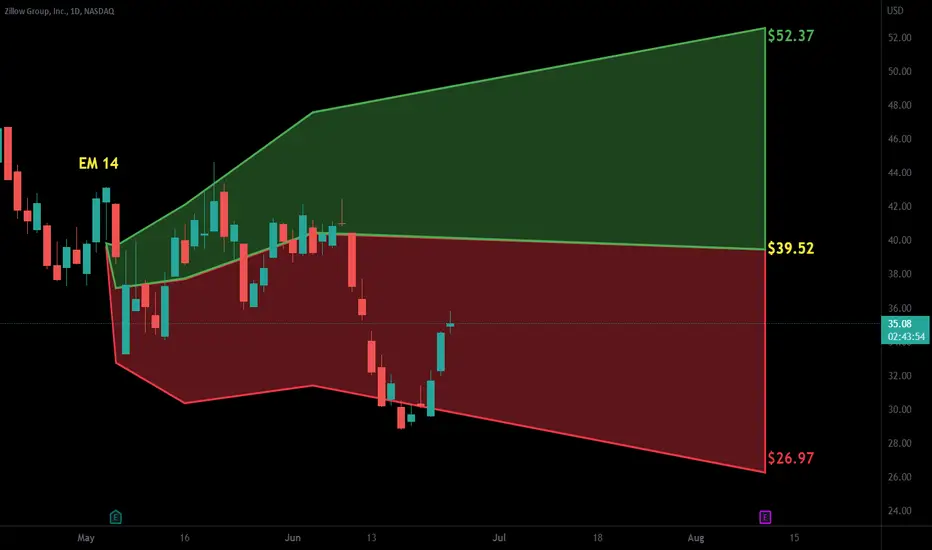
$ZG with a Neutral outlook following its earnings #Stocks The PEAD projected a Neutral outlook for $ZG after a Negative over reaction following its earnings release placing the stock in drift C with an expected accuracy of 66.67%.
$Y with a Neutral outlook following its earnings #Stocks The PEAD projected a Neutral outlook for $Y after a Positive over reaction following its earnings release placing the stock in drift B with an expected accuracy of 100%.

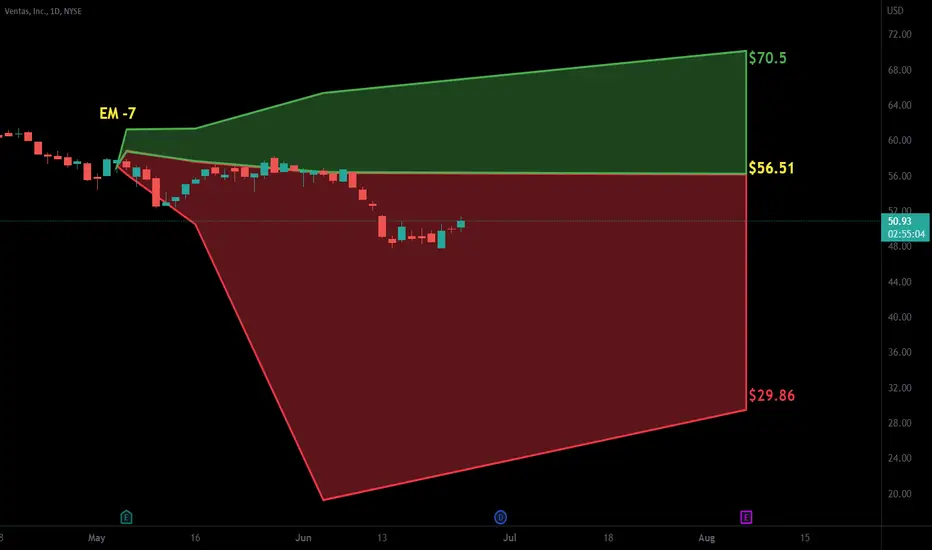
$VTR with a Neutral outlook following its earnings #Stocks The PEAD projected a Neutral outlook for $VTR after a Negative over reaction following its earnings release placing the stock in drift C with an expected accuracy of 71.43%.
SPX500 a short updateIt is easy to guess the top but the noise are hard.
All I can update is maybe we have a short term bounce to 3.9k these few days to close a gap.
If we manage to break below 3.7-3.8k , then the market will have higher chance to go down further as mentioned in my idea.
On the higher timeframe, If we manage to break above 4500, then My previous bearish bias will be invalidated.
I think we should have some sideways movement for few months for accumulation if it were to reverse the trend.
Just trade accordingly and be cautious!
Disclaimer - This analysis alone DOES NOT warrant a buy or sell trade immediately. Before you enter any trade in the financial market, it is very important that you have a proper trading plan and risk management approach.

EURUSD 15 TF Tuesday, LN session
I think daily bias is BEARISH, and SM wants to go below the swing low in 4 hour TF.
*3 last candle are in a daily range.
in 1 hour chart, price is bearish. I think it is going below 1.04400.
SM come below the 1.04982 level, buy the sell stops.
Does it go higher or no? I don't know for now

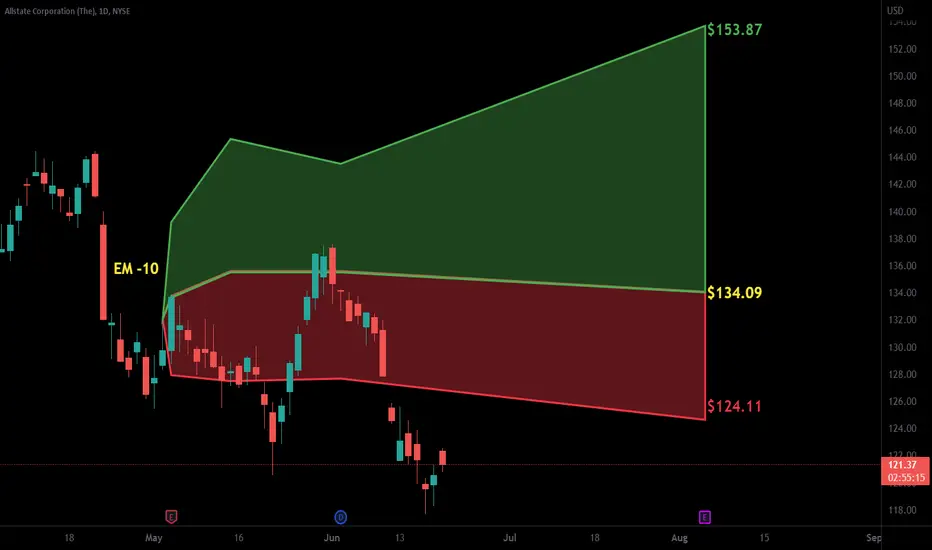
$ALL with a Neutral outlook following its earnings #Stocks The PEAD projected a Neutral outlook for $ALL after a Negative over reaction following its earnings release placing the stock in drift C with an expected accuracy of 100%.
$ATO with a Neutral outlook following its earnings #Stocks The PEAD projected a Neutral outlook for $ATO after a Negative Under reaction following its earnings release placing the stock in drift D with an expected accuracy of 66.67%.

$CF with a Neutral outlook following its earnings #Stocks The PEAD projected a Neutral outlook for $CF after a Positive over reaction following its earnings release placing the stock in drift B with an expected accuracy of 71.43%.

Neutral APE PatternCurrent 45m bull/bear cycles are looking consistent at the moment, this chart should be helpful for at least a couple days.

gold for next days OANDA:XAUUSD
we wait till Monday so market opens then decide our direction I also want to add that some "fake-outs" may happen due to sudden news or course change of market. so for example it can go above triangle and suddenly fall our confirmation is when it can pass through first pivots

btc is very hard game ı thınk boring this stiatıon but ı ll waiting The bottom level for btc, which will keep us waiting for a very long time, may be 17k. Even though this is terrible, we won't be able to do anything.

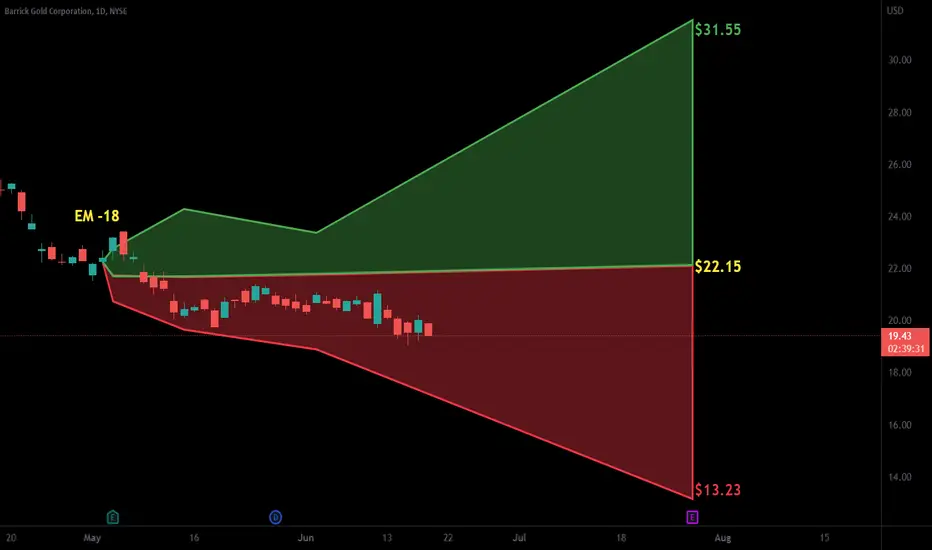
$GOLD with a Neutral outlook following its earnings #Stocks The PEAD projected a Neutral outlook for $GOLD after a Positive over reaction following its earnings release placing the stock in drift B with an expected accuracy of 85.71%.
$IDXX with a Neutral outlook following its earnings #Stocks The PEAD projected a Neutral outlook for $IDXX after a Negative over reaction following its earnings release placing the stock in drift C with an expected accuracy of 60%.

Continuation Phase - BTCWe are in the Continuation phase, the price of BTC will see a moment of awareness after a decline that lasted several months; its composition is therefore completely healthy.
The drawing tries to explain a completely natural movement in the price trend by bouncing on the "middle zone" between the two approximate bands.
Remain skeptical.

$LNC with a Neutral outlook following its earnings #Stocks The PEAD projected a Neutral outlook for $LNC after a Negative Under reaction following its earnings release placing the stock in drift D with an expected accuracy of 20%.

USDJPY 1H Zone Break IdeaLooking for this zone to break and provide movement in either direction. Waiting for break to get current time frame bias. Overall bias is bullish, but the Daily is bearish today (6/15/22).

$O with a Neutral outlook following its earnings #Stocks The PEAD projected a Neutral outlook for $O after a Positive over reaction following its earnings release placing the stock in drift D with an expected accuracy of 42.86%.

$PXD with a Neutral outlook following its earnings #Stocks The PEAD projected a Neutral outlook for $PXD after a Positive over reaction following its earnings release placing the stock in drift D with an expected accuracy of 33.33%.

OIL Price Action Suggests Bear WeaknessThe zigzagging nature of the OIL's price action suggests
that the bears are finding it difficult to keep OIL down.
Though we haven't enough evidence that OIL is a buy yet,
I suspect that OIL will be bought up at some point soon.
