BTC Price action analysis. Here I am again with BTC analysis on 1DTF, In this chart, I have imprinted my deviation and confirmation play around the support and resistance . On a higher timeframe, I am bearish as per the market trend of highs and lows. Now let's see where the market moves, as this week we have had a lot of fundamental news too.
Please response back with your constructive critisim. #Peace
Neutral

Neutral view for the week Nifty is more neutral to Bullish
BankNIFTY is neutral for now. Not Bearish till S1 breaks.
Expect market to hug CPR and range between R1 and S1 for most of the days this expiry.

STILL NEUTRAL ON GOLD DAILYDear Traders,
I am quite neutral on Gold for today until I see how the daily candle closes. From my chart, I could see that Gold is obviously bearish on the weekly but still leaving us with an unmitigated Fair Value Gap just below the daily order block.
I am actually looking forward to seeing Gold retest 2001-2022 zone and hoping to see a closure below the 1980 -1993 zone this week to revalidate my general bearish bias for this metal.
For now, I am going to wait to see what smart money plans to do with this pair today, then will follow their footprint.
Trade safely and apply proper risk management

🔀📊 USDJPY Triangle Setup: Trading the Breakout or Breakdown! Attention traders! Get ready for a captivating opportunity on USDJPY, unfolding on the 4-hour timeframe. It's time to harness the power of consolidation and position ourselves for potential gains, regardless of the breakout direction.
Currently, price is locked within a consolidation triangle, exhibiting contracting price action. This presents a highly favorable setup for astute traders like us. The imminent breakout or breakdown will unlock substantial profit potential.
As traders, our objective is not to predict the direction of the breakout, but rather to find a strategic entry point and ride the subsequent momentum(the yellow circles). By aligning ourselves with the prevailing trend, we maximize our winning rate and optimize our setups.
Should price break above the triangle, we'll set our sights on the target around 142.800. Conversely, if price breaks below the triangle, our target becomes 136.000. It's worth noting that implementing a sound money management strategy, taking partial profits along the way, is crucial to prudent trading.
There is a possibility to catch 300 pips on both sides.
Get ready to embrace the challenge and adapt your strategy to this breakout or breakdown opportunity on USDJPY. Keep a close eye on the price action and swiftly react when the moment arrives. Let's make the trend our friend and secure potential profits!
Don't forget to press the like button if you think this insight is helpful 🔀📊💪

$SBUX with a neutral outlook following its earnings #StocksThe PEAD projected a neutral outlook for NASDAQ:SBUX after a negative under reaction following its earnings release placing the stock in drift D with an expected accuracy of 66.67%.

COHR IS COSOLIDATION or traptaking support from 26 and 34, neutral to long, and looks fundamentally week , but technically strong on 28 and 34

$AMZN with a neutral outlook following its earnings #StocksThe PEAD projected a neutral outlook for NASDAQ:AMZN after a negative under reaction following its earnings release placing the stock in drift D with an expected accuracy of 66.67%.

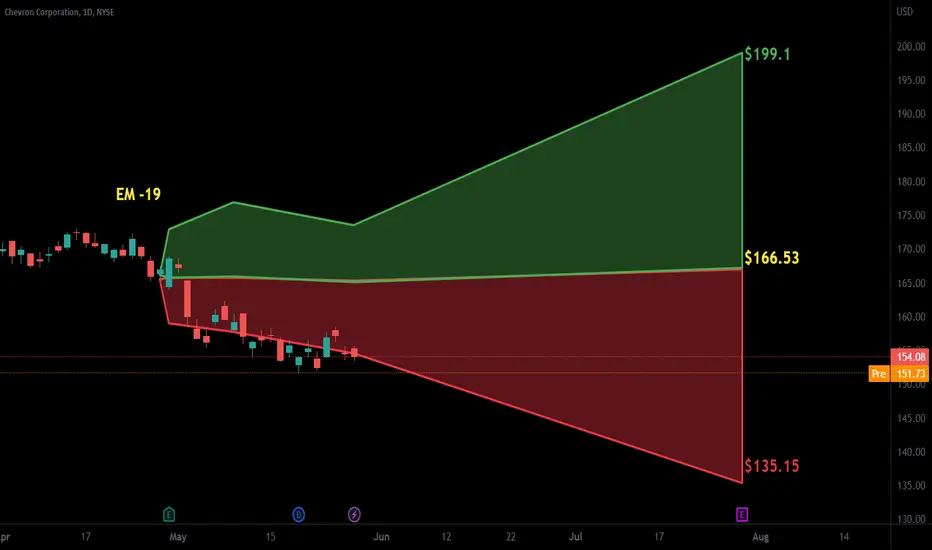
$CVX with a neutral outlook following its earnings #StocksThe PEAD projected a neutral outlook for NYSE:CVX after a negative over reaction following its earnings release placing the stock in drift C with an expected accuracy of 40%.
$CAT with a neutral outlook following its earnings #StocksThe PEAD projected a neutral outlook for NYSE:CAT after a negative over reaction following its earnings release placing the stock in drift C with an expected accuracy of 66.67%.

Market Rollercoaster: Harnessing Volatility with StranglesIn this video, titled "Market Rollercoaster: Harnessing Volatility with the Strangle & Iron Condor Combo!", Stock Justice walks viewers through an innovative and potentially profitable trading strategy designed for a highly volatile market environment. This strategy aims to exploit market volatility without being directionally exposed, making it an excellent choice for investors looking for non-directional trading opportunities.
Stock Justice starts the video by sharing his observations on the current market scenario, which has been stuck in a range for several weeks. He predicts that the market will soon pick a direction, and timing, as always, will be crucial. He then introduces the viewers to two of his favorite strategies for trading volatile markets - the strangle and the iron condor.
For Monday, May 22nd, Stock Justice details his plans for entering a directionally neutral strangle. He talks about scaling into the position slowly to manage risk and ensure optimal entry points. He also warns viewers about the challenges of fighting theta decay, especially as the options expiration date (OPEX) on Friday approaches.
The second part of his trading plan involves setting up a directionally neutral long iron condor for Thursday, June 1st. This strategy would achieve maximum profit if either the call debit spread or the put debit spread ends up in the money. Again, he stresses the importance of scaling in slowly to manage risk and optimize entry points.
Throughout the video, Stock Justice provides clear instructions on setting profit targets and stop loss areas. He emphasizes that while these strategies can be profitable, they also carry risk, so it's crucial to have a plan for managing potential losses.
This trading strategy video offers a comprehensive, engaging, and informative look at how to navigate and profit from a volatile market. Whether you're new to non-directional trading strategies or an experienced trader looking to refine your approach, this video offers valuable insights and actionable advice.
Stock Justice concludes the video by reminding viewers that trading, like any other skill, is mastered over time. So while these strategies offer exciting opportunities, it's essential to practice and continually learn to become a better trader.

NOC WCA - Head and Shoulders PatternCompany: Northrop Grumman
Ticker: NOC
Exchange: NYSE
Sector: Defense
Introduction:
Hello, and thank you for reading this analysis. Today, we focus on Northrop Grumman (NOC) on the NYSE. The weekly chart shows a potentially significant head and shoulders pattern that deserves our attention.
Head and Shoulders Pattern:
The head and shoulders pattern is a classic chart formation that can indicate either a bullish continuation or bearish reversal, depending on its orientation and the preceding trend. In this case, the pattern has formed over 441 days, making it noteworthy.
Analysis:
The NOC chart shows a clear uptrend, as demonstrated by the green upward sloping line and the position of the price above the 200 EMA. Both of these factors contribute to a bullish sentiment.
However, the formation of the head and shoulders pattern introduces an element of uncertainty. The neckline of this pattern, which currently acts as support, is at 431.61. A break below this level could signal a bearish reversal, offering a potential shorting opportunity.
On the other hand, a break above the right shoulder could indicate a continuation of the bullish trend. Given the existing uptrend and the position above the 200 EMA, the probabilities currently favor a continuation.
Conclusion:
In summary, Northrop Grumman's weekly chart presents a head and shoulders pattern within an uptrend, offering potential trading opportunities in both directions. Therefore, this is a chart to watch closely in the coming days.
As always, it's important to manage your risk appropriately and ensure that any trading decisions align with your overall investment strategy.
Please note that this analysis does not constitute financial advice. Always conduct your own research before making investment decisions.
If you found this analysis helpful, please like, share, and follow for more updates. Happy trading!
Best regards,
Karim Subhieh

Btc TradeBTC looking to stair Up to Get eq High and previous LL Lh OB its interesting looking to short here they will get rekt soon Week on Start let see market play out for us

Right in balance on intra TF as we approach weekendsBTC action is right in balance as we approach low volume weekends.
Lets see if there are any volume spikes which can give us hint about BTC movement.
Long term view is bearish.

COST Symmetrical triangle On the chart we can see symmetrical triangle formation which is neutral pattern.
In order to trade it you have to wait for the breakout with the volume increase.
Target both for short and long are shown on the chart.

$IBM with a neutral outlook following its earnings #StocksThe PEAD projected a neutral outlook for NYSE:IBM after a positive over reaction following its earnings release placing the stock in drift B .

$ELV with a neutral outlook following its earnings #StocksThe PEAD projected a neutral outlook for NYSE:ELV after a negative under reaction following its earnings release placing the stock in drift D with an expected accuracy of 50%.

$UNH with a neutral outlook following its earnings #StocksThe PEAD projected a neutral outlook for NYSE:UNH after a negative under reaction following its earnings release placing the stock in drift D with an expected accuracy of 66.67%.

$SCHW with a neutral outlook following its earnings #StocksThe PEAD projected a neutral outlook for NYSE:SCHW after a negative over reaction following its earnings release placing the stock in drift C with an expected accuracy of 60%.

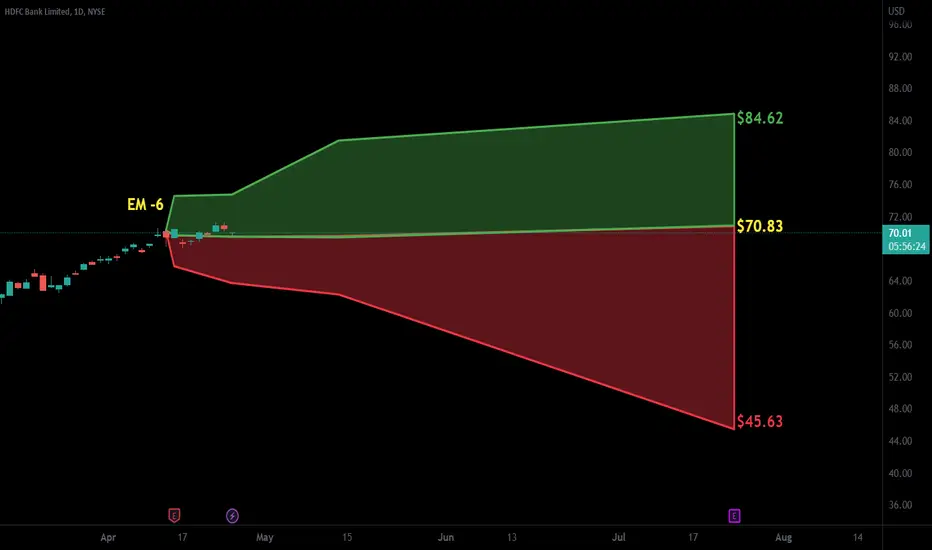
$HDB with a neutral outlook following its earnings #StocksThe PEAD projected a neutral outlook for NYSE:HDB after a negative over reaction following its earnings release placing the stock in drift C with an expected accuracy of 73.33%.
$NFLX with a neutral outlook following its earnings #StocksThe PEAD projected a neutral outlook for NASDAQ:NFLX after a negative under reaction following its earnings release placing the stock in drift D with an expected accuracy of 72.73%.

Waiting for Ascending Triangle BreakoutIf price goes below the red trendline then close spot and future long position. If price stays above red trendline then wait for green trend line breakout, then first target will be 0.050

Xrp pump to 1.00, If ?If 4 hrs triangle breakouts then target is 0.55 and if Double bottom W patterns on Daily chart breakouts at 0.55 then target is 1. Below the red trend line, Its bearish.

Big decision point for Divis labI would like to watch which side it breaks out, from there I would like to take a call. I will try to stay neutral at this point.
