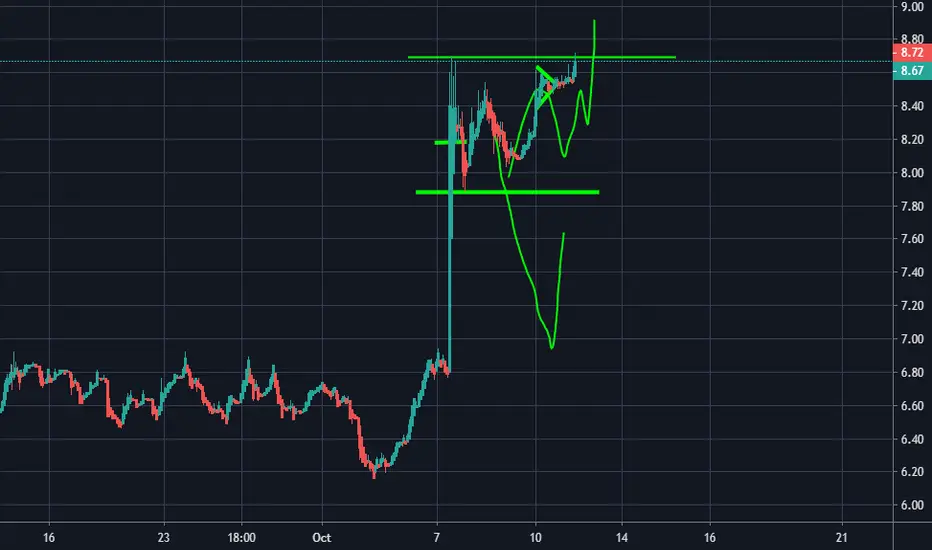
$X Iron Fly$X Iron Fly
Buy: 10/18 13c for .10
Sell: 10/18 11c for .63
Sell: 10/18 11p for .66
Buy: 10/18 9p for .11
Net Credit: $1.08 (Max Profit if pinned @ $11)
BP Reduction: $0.92 (Max Loss)
Profit Range of $9.92 - $12.08
Neutralposition

I Lied.....I'm Watching This One Too, but I'm Neutral I jumped into this one yesterday as well. I normally don't hold overnight, but this one was too good. Given the pattern, I have my stop loss set. If it goes below that point, I am no longer interested. I use to set my stop loss, I would sell, and continue to watch the stock hoping I was wrong (I usually wasn't). Once I'm out, I'm out. I have learned to trust my judgement more. If it falls below my stop loss, I'm out. There is no hopping back in......you had your shot lol. Good luck out there today guys.

Not a chance! Too unpredictable.YouTube: Dumb Money Trader
www.DumbMoneyTrader.com
www.twitter.com
www.facebook.com

DIA not as bad as SPY after todayBlog: www.dumbmoneytrader.com
YouTube: Dumb Money Trader
Thanks to all of my followers! I enjoy sharing my ideas with you.

CVX Iron CondorCVX Iron Condor Strategy
110/115/125/130
Seems very lackluster in terms of the movement, rsi is rising but OBV is bearish.
Price movement is weak.
Credit is very nice on a condor. $1.53 Credit on this strategy
Looking to exit first week of October for $90 credit.
Max loss is $180.

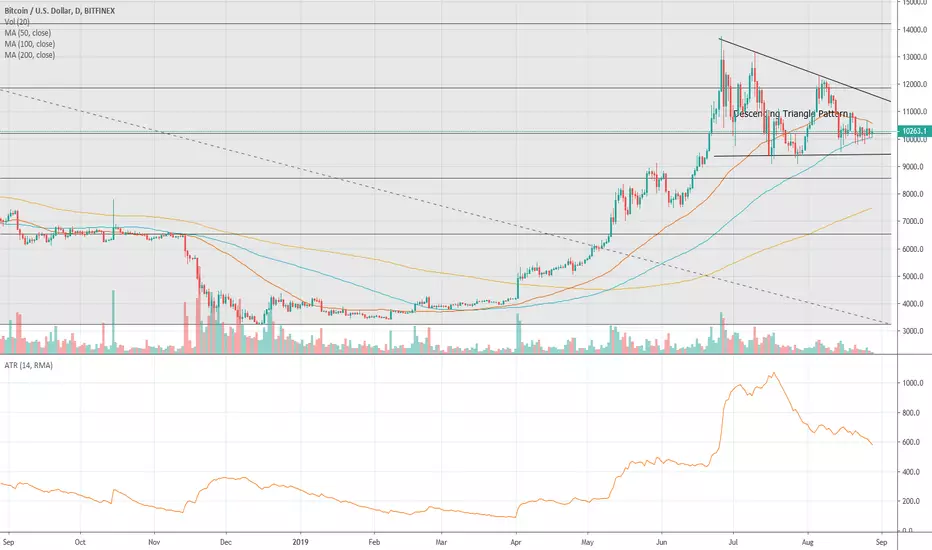
Bitcoin - Neutral - Still in Descending Triangle PatternWe still see Bitcoin in a descending triangle pattern therefore we are going to hold our neutral view as we see how the market develops. If the market were to fall below the $10000 psychological level and breach the $9422 support level at the base of the triangle we expect further downside. However, what is encouraging in terms of long term potential upside is that Bitcoin has been somewhat stable recently given it's volatile nature.
AUD/USD NEUTRAL (0.67980 or 0.66960)My BIAS for AUD/USD for the upcoming week is NEUTRAL.
My reasons for this is
-We are currently consolidating between a Daily Support at 0.67400 & 4H Resistance at 0.67980. Currently price is at 0.67486 just above our Daily Support so we could see a rejection of this level and a Long position towards 0.67980 or we could see a break below and a retest of our Daily Support with a Short goal at 0.66960 which is our previous 4HR Support that rejected upon a break of 0.67400.
Please Like & Follow for updates & future analysis.

AUDCHF POSSIBLE BREAKOUT OR REJECTION (NEUTRAL)The AUDCHF offer an opportunity to either short the market or go long.i would be wait for a breakout and a close above the o.66610 area or a price actions signal indicating that the bear are taking the maket down to the 0.65442 area

Expect a FightI usually do not publish on shorter time frames as the volatility is too hard for me to play with my professional finance job and personal life etc.
That said, I am expecting a fight between $9700 to $10k. Clearly the bulls want to make this an inverse H&S, and the bears want to crush this zone to the downside. I am leaning bearish short term only because we hit $9,800 and almost no bounce in sight. That said, the sell-off has been rather muted, not like the aggressive sell-offs of the past, and that usually leans in the bulls favor.
Most traders would say wait for confirmation one way or the other. I am not doing that. Let me explain:
$9,800 is not a bad entry point for a long if you are willing to take a hit on a stop. If we fall below $9,700, game over for the Bulls. Then I will plan to reverse the position to the downside and collect my stop loss + profit down to $9K, or, I believe $8K and below. Have waited 10 days for this set-up which has played out perfectly.
Good luck trading.

GE short strangle, July 12 9/10.5, 3+ month channel There is a clear channel that adheres to the peaks and troughs of the sideways trend on the price movement on the daily charts, starting from February 28th, 2019. Both the upper and lower boundaries of the channel have been tested multiple times during this period -- the more times the limits are tested, the stronger the both support and resistance become. The lower bound is at $9.00 and the upper bound is at $10.50.
By simultaneously selling the OTM $9 call and OTM $10.50 put, there is a maximum profit of $32 per contract reached if the price of GE is between at expiry. The break-even points are at $8.68 and $10.82 respectively. We are choosing the July 12th contracts as GE is expected to report earnings July 19th. With 25 days until expiry, as a net seller we will collect the theta premium as GE stays within the historical channel that has held up over 3.5 months.

Potential Long opportunityLooking at this pair this week, but waiting for it to complete the move to the downside. Will check where this pair will go this week, but I am looking at going long should there by a sign
What's your take?
TriforeX


GOLD - WEDGE SITTING ON TRENDLINEBIAS: NEUTRAL
I was short bias on this, which is still possible. However, Gold has formed a textbook Descending Wedge which is a considered as a continuation pattern but the only obstacle on its way is a very strong monthly resistance.
This wedge is also sitting on an ascending trendline and price breaks that trendline we are confirming a nice downtrend for Gold.
In conclusion, Gold is currently in no man's land, it would either break the wedge or the trendline, we have to play it by ear.
I am going for it to either break the two before I make a trading decision on this pair.

GBPNZD 4HR sell?Have been following wave trend. It has been consolidating for some time ahead of key data. waiting for confirmation

NeutralAs we can see that in 4h time frame EUR/USD is forming a triangle pattern, we don't know
that where will it break after completing it but still we can trade it's D & E legs

Gold is half way to both, sell and buy.Now its time to wait this week for an entery point, Gold is half way.

XRPUSDhi guys,Here we see that there is no one interested in xrp from start of 2019 , xrpusd wasnt able to attract any investment so far, Lets see What happen for this coin (y)

Want to be Bullish, But Need to be ConvincedNever buy resistance, never short support. I want to see this index get over 26190 for me to be a bull and the fundamentals are not all too convincing. Yes, China trade war is concluding in all likelihood, but then what happens if Trump decides to go after Japan or Europe on auto tariffs? We already know he doesn't want to quit these trade fights as seen with India. However, dovish Fed speak could be quite a boon for this index. More words on how the Federal Reserve could impact US markets and recent updates on US-China trade war here: anthonylaurence.wordpress.com

EURAUDSupport and Resistance comes into play on 4 hour time frame. Are we gonna break Resistance or retrace back to Support ??? Bulls or Bears???

USDJPY uncertaintyPrevious weeks close was with a rejection of the 200EMA which as history shows has been a point of both major support and also resistance. lets see where it ends up.

GBPUSD acorralando precio y perdiendo fuerzaGBPUSD despues de los fuertes cambios de tendencia gracias a las noticias sobre el Brexit, ha perdido fuerza y ha empezado a acumular en un banderin, esperamos el cierre de la vela de H4 en London Session para que la reaccion de precio nos diga hacia donde ir, si rompe hacia abajo, nos vamos en corto, y si continua hacia arriba nos vamos en largo.

Trend lines. Simple, yet powerful.We just saw this large drop in the last day which has hopefully found a new bottom on the green trend line, but I would not be surprised to see another drop to the yellow trend line in the 4500-5000 range in the near future. My opinion is that there are potential short term gains from this point, but you still have to be cautious.
