NEW
How I see the future of BitcoinThe last days have shown Bitcoin is still in the same bear market it has been in since the all time high. Every pump in between is just a correction (see: Elliott Corrective Waves) and has nothing to do with the start of a new bull market. A new bull market will start when most people have forgotten about cryptos and want nothing to do with them. That's what a bottom is - a period in time where there is close to no interest in the given asset class (see: BTC 2015 - 2016).
I see the start of the new bottom at around 2021 - the start of a new bullrun in around 2023.
Many people (mostly those who are emotionally bonded to BTC or want to get rich asap) see this theory as impossible or call it the death of Bitcoin - just like the last time Bitcoin went through a bubble in 2014 and did almost a 90% retrace. To me this is a normal thing to happen in cryptos so I would not worry, quite the contrary. The faster we reach the bottom the faster it will recover.
Good luck to everyone involved!
New York Watchlist: Finally! Great signs of a weak USD!Ok so the New York session is in full force and based on what we see on the DXY its really time to short the US Dollar!
We found this nice setup on EURUSD long... and plenty of the charts agree with the 1H giving us a gorgeous pin bar, aside from that we have a major contraction on the 4H chart indicating a reversal is near.
The DXY is showing excellent selling opportunities vs the USD and we decided to go long again on EURUSD!
GbpUsd - BREXITOn Friday I analyzed GBPUSD for a short opportunity, I was wrong. After the currency pair was broken down, I identified a strong sell opportunity as displayed with my technical chart work. The GBPUSD currency pair was in a 4hr range for the past few weeks and is now showing signs of a breakout emerging. In my opinion that breakout was to be to the downside seeking to 1.295 region or below.
Now I have adjusted my analysis and I will be taking along position due to the approval and confirmation of BREXIT
Atom Still Making Higher Lows Within Ascending Channel Have had my eye on Atom for quite some time now.
There may be an exciting opportunity here as this is a "new coin" that has not seen the pump of a bull market.
Fairly low total supply about 3x of Ethereum.
I was lucky enough to get a very small bag of $7 ETH by total chance so Im fully aware of what is possible.
Interoperability will be a major need in the world of many cryptos.
I believe few cryptos will stand at the end of the blockchain bubble but that is a long ways off.
.com bubble was mainly US investors and it peaked around 6 trillion. Crypto is global....
Time will tell. Wish everyone the absolute best. Cheers
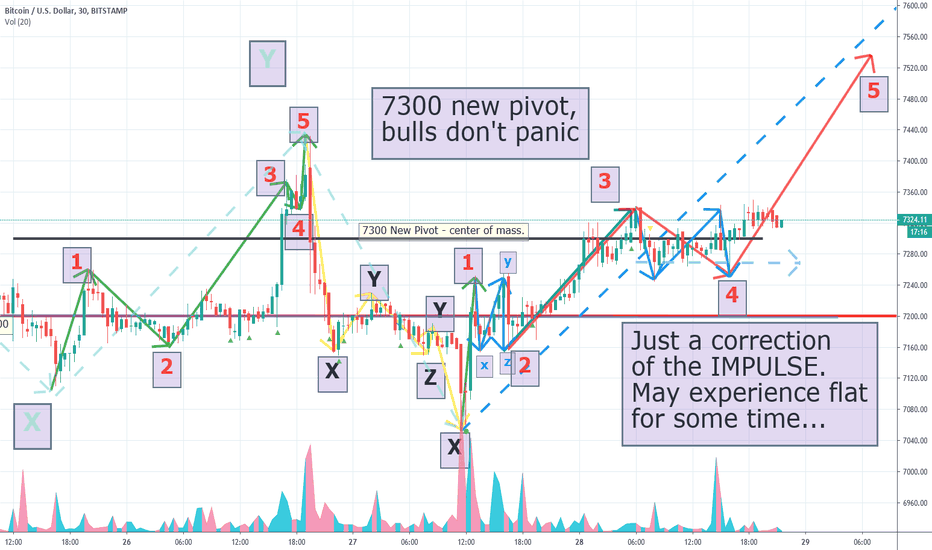
Bullish confirmation came in.Remember what happened earlier...
1. We have been continuously defending 7200 pivot,
and all the shorters in the world couldn't bring us down to 7100!
2. All previous bearish moves, all consisted out of typical correction forms
which proves that bears finally lost their power.
Bitcoin is now considered cheap if it is sold at 7200.
3. We have been experiencing a prolonged flat around pivot 7300.
This flat accumulated a lot of orders, both sell and buy.
Nevertheless we rocketed up to 7550 and even then! We didn't fall
(as we certainly would if the bears were strong).
4. Now we can observe a little slide back down to 7350,
defending the 7400 pivot. If this flat will continuously bounce around
7400 pivot(7387-7425 levels), then It becomes clear,
that big players are no longer shortening!
A few hours 'till the asians wake up at 00:00 UTC and we will definitely
see a lot of volume kicking in.
There may be a pump up to 7600-8100 or a bottom retesting at 6900.
In any case here it comes!
Medic, quickly!If this one bar doesn't stop the drop,
gonna go to sleep.
Because it will be either the bulls from now on
(It's the last chance for bullish run)
or
the bears will drop to 6999(IMHO - possible, but unprobable) or less.
I personally believe in this soldier
and so should you(was watching closely 7200 all day - I'm telling ya - it's a TOUGH NUT, the bulls are with guns patroling 7200. The bears must panic in agony)!
IM NEW TO TRADINGVIEW, Come say HELLO :) My name is Aimee and i am from the UK, i have been trading over 5 years but have only just been introduced to tradingview so i am excited to see what all the fuss is about :)
I am currently trading full time and it is my only income so i do pretty well, i am a full time mother to my 3 year old little boy so trading lets me spend as much time with him as possible, in my spare time i train in MMA and kickboxing.
Now time for my first analysis, Gold is going up, looking at the trend line that has been well respected im positive we are going to ride on the back of the bulls for a while, looking at the chart we also had a lovely support area that was respected before this push up.
Wow that was scary, i hope you all like it :)


