NEW

EUR/USD the #eurusd hit a level of "support" at the 1,0904. It found support at that level.
The #momentum has shifted to the #bullish side. I think, it's good time for #buys
(not for me, but bc'se we're at the end of the year) still #buys #environment till 1,1185 level "#eye's sign"
this framework can still pan out till 30 january 2020, then #news #brexit #vote
A possible R:R 1/2 is achievable with a nice good risk management

Weekend Wisdom 02 - Making MoneyMany new traders are too focused on making money by picking the perfect entry that they forget all the other aspects of trading.

McAfee PredictionWhat we are all hoping for,
This is my own personal expectation and prediction after the May 2020 Halving
$90,000 October 13th 2020
KingMida$423 11/15/19 11:25pm EST

"NZDCAD: Top and Bottom Analysis" by ThinkingAntsOkDaily Chart Explanation:
- Price is on an important Support Zone .
- Bullish Divergence on MACD .
-If price starts its up move from here, it has potential to break the Descending Channel and, then, go towards the Middle Resistance Zone . If price also breaks it, there is potential to move up towards the Major Resistance Zone .
Weekly Vision:

SEACERA - Seeking New Direction Above MA200SEACERA - Just recently broke out from MA200 with widening Bollinger Band, MACD & RSI both still in their bullish trajectory. We anticipate the stock is now trying to complete its consolidation formation within the symmetrical triangle drawn in the chart, any chance to breakout shall unleash fresh bullish momentum towards 0.315, support observable at MA200/ 0.245. Please note: PN17 counter is highly risky to trade.

AUDCHF sold> AUDCHF broke the support level and you could observe the BIGGIES shorting near the MA and the breaking of support confirms their short move.

EURAUD LONG POSITIONTRADE IDEA FOR THE EURAUD .. WE STILL HAVE FIELD TO GO LONG BEFORE THE RECESSION .

Apple's presentation of the new iPhonethere is a proverb:
growing on expectations, falling on facts.
I think the campaigns of the eppl campaign are no exception.
I think the new iPhone will give investors confidence in stock growth.
As a friend recently said shortening in the stock market, it usually ends with a drain of the deposit.
Long is preferred.
stop for the breakdown line; the target is at least a test high.


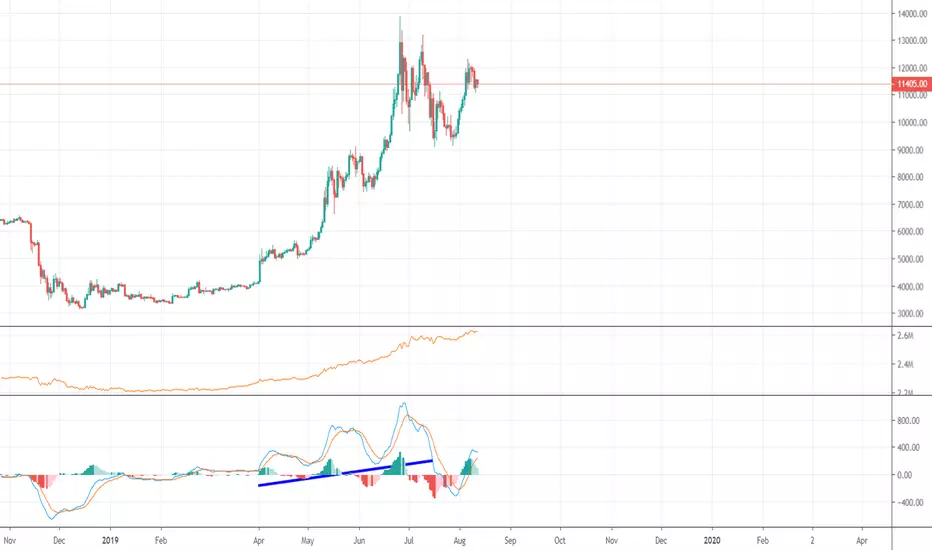
BTC WAITING FOR TRIANGLE RSI CROSS\u2028\u2028 & 50 levelHi everyone,
\u2028\u2028this is just a way how this Btc situation could play out.
I have been playing and trying to do some analysis only using RSI. This is how it ends. Maybe.
\u2028\u2028There are two blue triangles on the chart. We are waiting for any break.
If RSI happen to break up, this will be very bullish signal. Similar in the opposite direction. \u2028\u2028
We are waiting for 4H closed bullish candle or ideally for closed 1D in the area of 11 000 $ per changing a Bias to Bullish. \u2028\u2028
The action can be small, but it would give us better probability of doing new ATH soon. \u2028\u2028
You can also see that RSI is going to cross level 50 soon.
Plus there are two RSI Bullish divergencies.
Over all i see it BULLish, even thou iam hearing lot of BEARish noice around. Specially on Twitter.
This is not a financial advice. Iam begginer, learning TA and this is the way to check strategy … \u2028\u2028Please comment.
Does anyone have a tip for backtesting program for beginners?
I dont know how to code yet, so something simple. ?
\u2028\u2028Thank you & lot of luck to you all ! MATT\u2028\u2028
“Rising tide is lifting all boats”

GOLD & SILVER STOCKS ARE OVER BOUGHT! HYPE IS DRIVING THEM UPFolks, we hate to burst the bubble but...
Has anyone looked at the charts of the GOLD and SILVER stocks?
RSI, MACD and Stochastic indicators are so over bought, it is alarming and sounds the DEATH KNELL for both sectors. Anyone telling you differently has no idea what they're talking about.
To top this argument off, the big companies like GOLD and NEM are making nothing, no big profits, to run to the bank with.
Both companies recently purchased other gold producers and as of late, neither company can turn a nice profit. Look at the earnings reports...It's the truth!
In fact, GOLD barely hit estimates and revenue was down missing estimates. WHY..? ASK YOURSELF WHY? THE NUMBERS DON'T LIE!
Why are all these GOLD & SILVER companies in Canada? We've never done well with Canadian stocks because at the end of the day, most if not all turn out to be a huge scam.
Both GOLD and NEM have had plenty of time to sell gold at these record prices but yet both companies are unprofitable or making a few cents. Why is this?
We cashed out of all our GOLD & SILVER stocks today and we will not look back. Even if GOLD hits maybe 1600 to 1800, and SILVER hits $20 to $25, none of the stocks we follow are making money and from what we can see, they will continue to lose large amounts of money into the future.
Take your profits in the stocks and move into the Indexes, ProShares, SPDR's and ETF's to play it safe. Here's are several for you to research: GDXJ, JNUG, UGLD, GLD, GDXJ, UGL, GDX, DGP, BAR, GLDM, IAU, SLV
Every piece of GOLD & SILVER these companies find & produce is sold forward which means, they missed out on the record high prices as of today.
Also, where are the nice 2%, 3%, 4% and 5% dividends from all these companies if they're doing so well? Wall Street wants you to believe that because GOLD & SILVER are at record highs, GOLD & SILVER stocks should follow.
This argument is one big FRAUD AND A HUGE SCAM!
TAKE YOUR PROFITS AND DON'T LOOK BACK...WE DID TODAY...NEVER ARGUE WITH A PROFIT!!
BEST OF LUCK TO EVERYONE WITH YOUR TRADES!
DISCLAIMER
This website and our posts are for general information only. No information, forward looking statements, or estimations presented herein represent any final determination on investment performance. While the information presented in this website and our posts has been researched and is thought to be reasonable and accurate, any investment is speculative in nature. StockKid, and/or our agents cannot and do not guarantee any rate of return or investment timeline based on the information presented herein.
By reading and reviewing the information contained in this website and our posts, the user acknowledges and agrees that StockKid, and/or our agents do not assume and hereby disclaim any liability to any party for any loss or damage caused by the use of the information contained herein, or errors or omissions in the information contained in this website or our posts, to make any investment decision, whether such errors or omissions result from negligence, accident or any other cause.
Investors are required to conduct their own investigations, analysis, due diligence, draw their own conclusions, and make their own decisions. Any areas concerning taxes or specific legal or technical questions should be referred to lawyers, accountants, consultants, brokers, or other professionals licensed, qualified or authorized to render such advice.
In no event shall StockKid, and/or our agents be liable to any party for any direct, indirect, special, incidental, or consequential damages of any kind whatsoever arising out of the use of this website, our posts or any information contained herein. StockKid, and/or our agents specifically disclaim any guarantees, including, but not limited to, stated or implied potential profits, rates of return, or investment timelines discussed or referred to herein.

BTC oversold 4 first time Bitcoin oversold for the first time in 2019.
The sellers failed to bring the price down like in January 2018.
The news are Bullish.
Big Whales are holders.
And i arrived in the English community.
Stay tuned for more update ;)
XRP up to 60 CentsSimple Pitchfork channels work Un-doubtfully well
Desktop users span out and look at the total over view of this chart.
Mobile users your just gunna have to trust me on this
Long position open up to ~60 cent mark
May re open it it shows signs of going up to the 80 cent resistance line.

CRASH IN BITCOIN IS NEXT WAVE DOWN TO 8800CHART BELOW IS THAT ONF MY WAVE COUNT THAT GAVE ME TWO TARGETS ONE 11200 AND ALT 12100 TO 12400 IT PEAK ON TARGET I NOW SEE IT TRADE WELL BELOW 8800

ANZ trading opportunitiesANZ looks ready to drop after poking at the .618 fib level. exit short or buy anz at the zone shown below.


here is my first chart analysisplease give me any feedback on my fib levels or if i am even using it right and on my ema's i am only using the free version so i am limited to three indicators i wish i could use vol and rsi to help but this is what i have for the short term trend we are starting to get out of or maybe not.

MCOA Long Bullish IndicatorsProceed with caution, this is not financial advice. I merely intend to inform you of my observations and of my personal position. I am of course biased as I have already chosen to invest, but I feel bad not letting others in on this lesser known stock with very bullish outlooks.
I recognize bullish indicators in my Stoch RSI and in candle analysis. Also, the company is coming out with several new products, new partnerships, and spent 38 million in R&D last year, likely for their upcoming "Viva Buds" app wherein users can order cannabis to their door on a subscription basis. They purchased 20% and issued one million in stock of a local cannabis distributor to the CA area. The fact that they issued so much stock to business partners suggests to me that they expect its price to increase. I would assume they also spent money on app development, but far less. This means that this stock is a bunny waiting to hop. In 2000 before the crash with prices of over $600, lots of skips and hops after declining to 30 and below. Now at a price of .0059, where can the price lie in even 6 months from now when the app is at market? Since they invested in an existing distributor, the infrastructure is already there. Now, their software will enable the monetization of all of their R&D from last year. They already have a CBD lotion and other products at market. On top of that, today they filed for a reverse stock split. I am personally accumulating as much of this stock as possible while it is at what is essentially a round of public capital raise; a re-IPO if you will.
Be careful,
Best.

Us30 Short Idea *updated* 7/22Waiting for a break, retest before entering for a sell!
*This is based off a strategy i am backtesting*

Effeerayom: gonna be tough to go below 220$ and 190$Ether is soon to form a daily Smma golden cross.
Late compared to Bitcoin, but hey it's an Alt coin.
When the golden cross will form, the target will be the monthly main resistance
Support at 220 is going to be strong, support at 190 is going to be very very strong.
Lot of upside potential, not a lot of downside potential.
Super good RR long term holding Vladimir's baby.
When the previous Smma golden cross happened, Ether was at... around 18$


Could this be where the market is heading?We seem to be going through the same emotional ride as we did before in the last bubble but with just less participation and news coverage. There are now existential threats no longer round the corner, but actually upon us, Libra and regulations are not good for crypto price appreciation. Adoption, if it ever actually happens as is currently predicted, is still miles away. Coins are worth 10's, 100's of millions or even billions in magic internet money that can be converted into fiat (if you get there first) with no product and no customers. Libra has brought crypto to the forefront of the agenda for world governments and pretty much none of the commentary is positive. What if we are setting up to put in the exact same pattern as before and head to new lows like this. I welcome contrary opinions.
