Super new to this forgive my lack of knowledge Hey first post here im fairly new to charting and TA
Am i correct with plotting the resistance line? or am i off?
Thanks in advance!
NEW

No one knows about you yet but they will soon! QLINKQlink is according to me one of the undervalued coin in the crypto world. It definitely have a high potential for growth and deserve (will be hopefully) in the top 100.
Confirmation above EMA line and uptrend shows strength. Great opportunity to buy in.
Best of luck!


QCOM, AAPL, OLED - Coincidence on new iphone plans?TELECOM Sector
Qualcomm snapdragon chips tend to go into cell phones #QCOM
Apple introducing new iphone as release X a fake release to 5G #AAPL
OLED displays are the best in the market #OLED
STM chips for ASIC might be made by someone else #whoknows
AXTI 3D sensors might have competition ?? #whoknows (not PM)
Yes, I left out AMD, which might be making the GPU, who knows ?? #toolate-shipsailing
Am I more interested in Softbank comment on new Japanese Telecom Carrier IP and needing big investments from banks.
Bought OLED in August. QCOM in Sept. Sold AXTI for now...3D sensor users needed. STM well holding on for no good reason.
These are all prognostications and viewers come to own sense of reality, investing, and humor.
Samsung / 5G-Apple here's a new product idea: I'd love to see a whole house smart phone system. Every phone has WIFI, display, GPU, etc. for under $1K or abouts.

OVID time to get high.....on gainsPharmaceutical company these are starting to become my new drug. Propah gains to be made! This thing moves fast af! bullish all the way.

BTC/USD 2018-2020 Accurate Price PredictionThe Rothschilds, JP Morgan, Wells Fargo, tv celebrities and do I even need to mention Goldman Sachs already has put in a trading desk? Very bullish period ahead to cure our tender hearts from this chilly bearish season. Stock up next dip guys. #2018TheLastYearNormalPeopleCanBuyBitcoin

[NEW] ETHEREUM PatternHi everybody! Hope you got a nice weekend! Let's start the week with heavy stuff!
This is a new pattern I seen on the forex market but in theory it will be applicable to every markets. It's based on the triangle pattern (break and pullback).
But with manipulation we can clearly observe a diamond pattern caused by indecision and manipulation, so we can call it the ETH pattern!
Hope you will enjoy this method and get big profit with it!
Like and follow to support me
Produced by Jean Neymar

MY Analysis on the NZDJPY there can be two outcomes to this one it could hit the bottom S/R and go to the top or rise all the way up to the resistance and break through or bounce back.

NZD/USD daily reviewIn the aftermath of the break out to the downside by the NZD/USD pair, a new junior descending pattern was discovered on Wednesday. Namely, there exists a pattern, which has guided the currency exchange rate since the bounce off from resistance that occurred at the start of Tuesday’s trading session.
However, judging by the range of the new pattern and the previous, it can be deducted that these two pattern represent junior movements in a larger scale pattern. Although, the exact trend lines of the larger pattern are still not clear.
In regards to the short term future, the rate is set to surge up to the 0.6820 level, where it will meet the junior patterns resistance together with the 100-hour SMA.

A new wave is just starting!!As it was predicted before BPMX ended already a previous wave, crossing under 0.21 in order to start a New Fresh Wave, the most waited moment is here, I hope you do not miss it this time, this new wave is looking very promising, take a look at these candles and tell me please what do you think?
Can you see the same picture that I have on this end?
I am going long at least until the end of the month!!
Happy Trading!!

Update previous TA, still the same just bigger OK, so i made a mistake in last TA, but more importantly i may have made another discovery on how to predict the size of the next phase compared to that previous of it, i will look in to it further before i make more of a fool of myself by publishing it. But i think my mistake on the last TA is that the right green phase 3 shpould be 3 third bigger than the left phase, so i have adjusted my chart to reflect BTCUSD
AS my methodof TA is being made up by myself and is multi interval TA, meaning that a mistake in an interval higher will make everything under that incorrect. So i will have to be very careful on higher time intervals.
Also, letts see if the shape of interval 2's second part is the same shape resistance line as the whole of green phase 3 s when action is live (can always make something fit if looking back on it so want to see if it plays out in live mode)

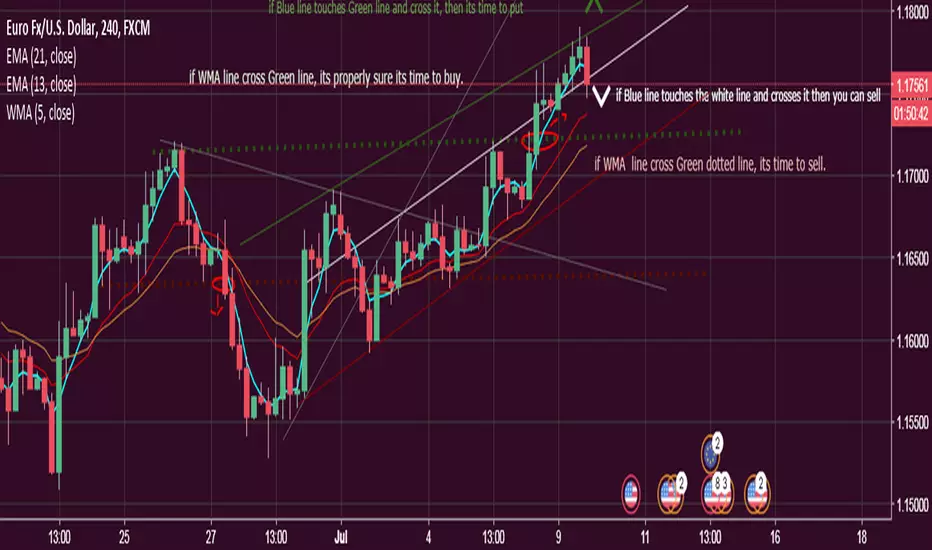
EURUSD Lets see Buy/Sell and REMEMBER TO SEE MY PREVIOUS EURUSDEVERYTHING is clearly mention in the chart if u don't understand still, don't heisted to ask me. and i keep one chart update all the time. so you will find my past analyzing too in it.
NZD short??Here I have analyzed the NZD USD currency pair and this one will fall hard upon the release of credit card spending in NZD. RIP to the buyers of this pair. Happy trading !!!!

QKC/BTC 17% profit now?Is it me? or this trade seems just perfect (on a Bearish market)?
This isn't a financial advice... be aware.

NZD/USD daily reviewThe previous assumptions about the NZD/USD pair were false, as the rate surged in the second half of Wednesday only to be squeezed in between various hourly simple moving averages.
Meanwhile, our analysts did a full review of the pair. Long, medium and short term patterns were discovered.
Essentially the currency exchange rate was expected to continue to surge in the short term as soon as it passed the resistance of the 55 and 100– hour simple moving averages near the 0.6920 mark.
If that would occur, the most dominant trend line near 0.6950 would be targeted.

The Digital AgeIt's a revolution.
It's innovation.
It's machine over man.
It's math over control.
It's your history.
It's Bitcoin.
"cause she's never catching a man. if it don't pan out, i'm a flash in a pan. Young Leonardo, try catch if you can. we just spent the night now send her back to her man." - G Eazy

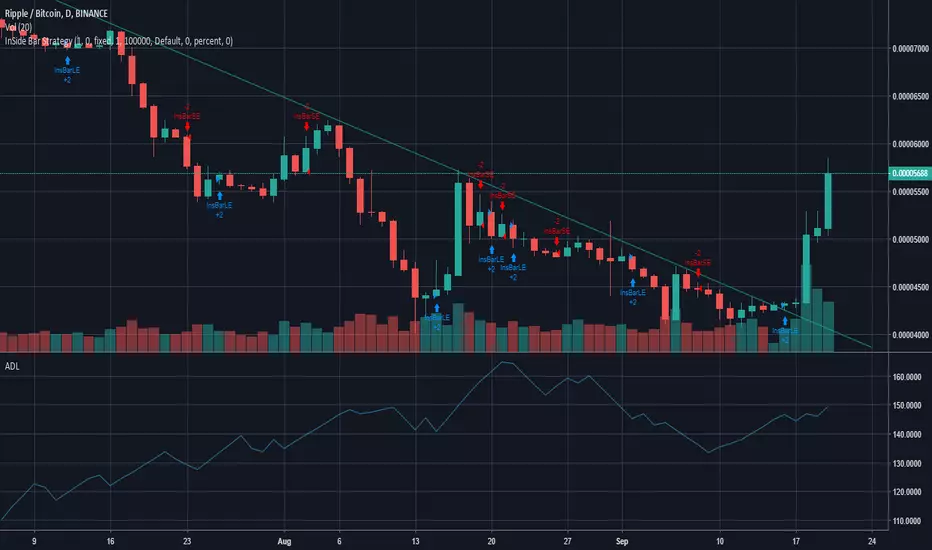
BTC (VOLUME STRENGTH CANDLES) **NEW INDICATOR***INDICATOR:
Is Price Action Higher or Lower on STRONG or WEAK VOLUME from lookback
(Strong or Weak Bulls // Strong or Weak Bears)
Candles / Bars Indicate the Following (default 13 period lookback / Length)
MAROON (I changed mine to purple) Bear Candle with STRONG VOLUME more than 150% of the lookback / length (13 default), STRONG Bear Candle Confirmed With Volume
RED Bear Candle while VOLUME is BETWEEN 50% & 150% of the Lookback / Length (13 default), Neutral Bear Volume Neither strong or weak
ORANGE Bear Candle with WEAK VOLUME (Less than 50% of the Length / Lookback)
DARK GREEN Bull Candle with STRONG VOLUME MORE than 150% of lookback
GREEN Bull Candle with Neutral VOLUME BETWEEN 50% & 150% of the lookback / Length
AQUA Bull Candle with WEAK VOLUME less than 50% of the Lookback
Is price confirmed by volume?
Can Change the Lookback / Length from 13
Can Change the Colors and Transparency to easily see based off your chart background colors I recommend ZERO Transparency to easily identify volume strength (i use white background but many use black or other)
FULL volume based LAYOUT: www.tradingview.com

BTC hindsight.
link to external chart with what im talking about since im a trading view noob
imgur.com
New trader, mostly just publishing an idea to get something out there.
Looks like in hindsight when the entire asset class is making large % moves upward for days at a time it would make sense to view the upward moves and the challenging of resistances in this under rated light, without any RSI.
Basically if I were to have looked at this simple indicator during the bull run I would have seen that the Price/Volume indicator channeled downward after the first rejection of the 99xx area. When we began to climb again toward 99xx, the Price/volume indicator stayed flat. This is a sign of losing steam, and although simple can predict the timing of retracements such as these or yield good exits.
Good luck and happy trading!!

Been in $WUBA calls over multiple months and strike prices. Looks like $WUBA is ready for its next leg as old longstanding resistance became the new support this past week.
Note the weekly chart; from resistance to support :0)
NYSE:WUBA

Similar trends to ltc and eth leading up to a breakout Looking at the clear trend its following very similar to LTC and ETH, the two channels leading up to a potential breakout.
looking for volume increase for confirmation


NZD/USD reaches supportBy the middle of Monday’s trading session the NZD/USD currency exchange rate had reached the vital support levels near the 0.7150 mark. Coincidentally at that level a dominant support line was located together with the freshly calculated first weekly support level.
It is highly important to watch whether that level will hold its ground for some time. If it gets passed, the 0.7090 mark will be reached next. If the rate manages to rebound, a surge back up to the 55-hour SMA could occur.
However, the pair’s decline has been largely caused by fundamentals not due to technical reasons. So the rate is more likely going to ignore the technical level’s support.
