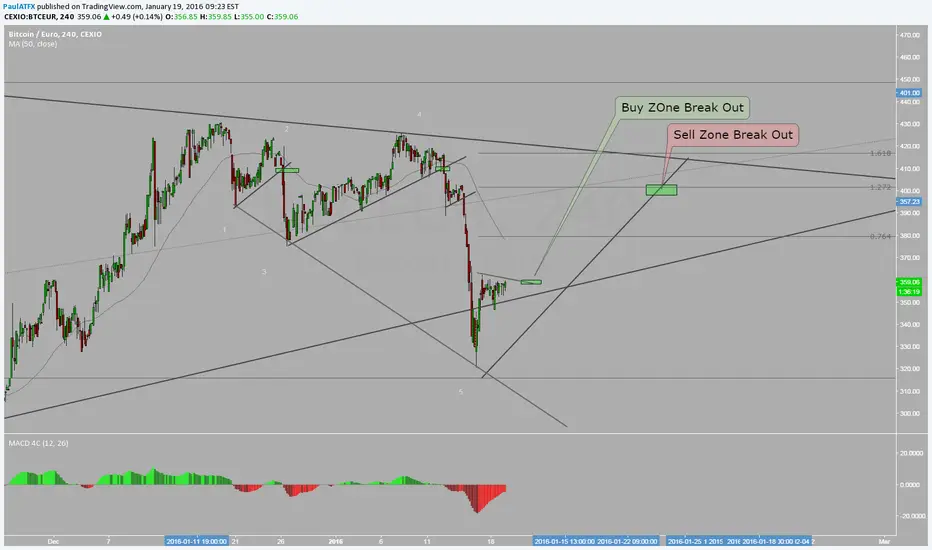
BTCEUR New Set UpLast time i saw a set up but it doesnt triger , lets see if this Set Up Breaks out nicely
NEW
Two potential shorts on GER30The current uptrend(see elipse on chart) the last couple of days has made things a bit difficult. I was expecting a temporary pullback. It sure came! But it came way later and way deeper than I had anticipated. Ergo, we have now two potential shorts.
Keep in mind, if price decides to ignore the first red area and reaches the 2nd red area, the current long positions(see my other GER30 chart) get invalidated. So if it only reaches the 1st red area, the other long positions are still valid.
As usual:
1. If price touches the red area, check if there is divergence on either MACD or stoch . If step 1 is fulfilled , continue.
2. If step is 1 fulfilled, we want to see either a double- bottom / top or w/m pattern forming on M15 or M1 . Will demonstrate those patterns when the time comes. If step 2 is fulfilled , continue.
3. TP/SL will be set when necessary price action takes place in those areas. We will always wait for pullback no matter what. No pullback, no trade . If step 3 is fulfilled , continue.
4. SHORT when PRICE makes lower low . If it doesn't and instead makes higher high , abort this potential SHORT and look for the next red area.

BEAUTIFUL OPPORUNITY IN NZDCADEven if your entry is at market the risk/reward opportunity is fantastic. Ideally, we want it to test ~.9550 and take a low risk entry short position there. I think there is something brewing in the Canadian dollar, not just this particular cross..

NZDUSD - Long with Correlated CommoditiesNZDUSD - Long with Correlated Commodities
Chart explain itself.


Christmas and new year's eveThis ADX seems to be heading to a third wave that will be stronger than the other previous two. There may be some retracing in between with a short opportunity between now and christmas. I believe we will keep on an old support and won't go below 400. Then Santa's rally will come and keep up till 2016, then.... who knows, hopefully some sideways calm period, perfect for your january vacations.
Once the trend on the ADX establishes, it rarely reverses in the middle.
Would like to hear your comments.

Cypher Completion on GBPJPY Looking for New Structure High Cypher Completion on GBPJPY Looking for New Structure High

NZDCAD SHORT TRADE H4 PIN BARA PIN BAR HAS FORMED ON THE H4 CHART. STRONG DOWN TREND ON THE DAILY CHART.
FALLING TREND LINE
TAKE PROFIT IS SET TO HALF MY POSITION AS I THINK THERE COULD BE ROOM FOR POSSIBLE FURTHER DOWNWARD MOVEMENT. STOP WOULD BE MOVED TO BREAK EVEN.

NZDUSD -Multiple rejections at 0.7700 level keeps things BearishFailure of the Kiwi to retake above the 0.7700 level keeps the Bearish tone alive and well. A break this week below the T-Line from the 0.7191 low is likely going to see the pair retest the bottom of its range at 0.7191. Only above 0.7700 puts the Bulls in the driving seat.

BIOC Cancer Diagnostics Eliminates Biopsies with Blood TestBlood diagnostic OncoCEE-BR was used by Columbia University College of Physicians and Surgeons in New York City to aid cancer patients' diagnosis. Involved biopsies are no longer required, cancer can be detected with a simple blood test. The chart has strong bullish divergence, has just made a breakout with an initial target around 4 dollars.

NZD - 1HR TrendThe NZDUSD is in a really interesting place right now it is currently trending upwards and looks like it will be doing so at least for the next few days.
I am currently short right now however I will be buying and selling several times within this trend.
I was long yesterday.
This is an incredible opportunity with the average trade ranging from 50-70 pips.
Trigger Trades - Precision Trading

****IMMINENT STOCK MARKET CRASH AT HAND??????******STRANGE******I have not one clue about why this market is behaving the way it is right now . . . The exponential moving averages and the simple moving averages on the DIA suggest that the market is very bullish. MOREOVER, if one takes a look at the ADX indicator, the RSI indicator, the Stochastics indicator, and the MACD indicator, all of these indicators suggest a pullback on a Daily chart. HOWEVER, although the indicators suggest a pullback, strangely enough they tell a different story on a weekly chart. MOREOVER, on a weekly chart the indicators display massive divergence in this market that has been building up for SEVERAL MONTHS!! Furthermore, now that the month of October and November are quickly approaching, then perhaps one would need to consider some precaution, for it may be possible that this weekly scale divergence may unfold during the coming months . . .

London Session Watch EURGBPEUR/GBP has been quite volatile recently which was caused by both the Pound and Euro dollar. There's no obvious trend over the long term horizon but based on the shorter time frame, we do have bullish momentum going on in this market as we can see through the up sloping trend line and Tenken-sen continuing to stay above the Kijun-sen. The current support level is at 0.7977 and the resistance level is at 0.8036. We can also see that there's an inside bar candlestick pattern formed at the 0.8036 key resistance level which could cause the price to have a little pullback before it surges higher. We could potentially have buying opportunities near the trend line and 0.7977 support level in todays London session.

Alliance Grain Traders (TSX:AGT) safely in uncharted TerritoryThis long term top performer is now safely into uncharted territory.and appears to be a low risk BUY.

New High ... more gains likely for Rock Energy (TSX:RE)New HIGH and Positive indicators seem to promise bigger things to come!
