The Great Trap: How Billionaires Are Winning, and You're Not!The Great Crypto Trap: How Billionaires Are Winning—And You're Not
The ETFs, Saylor, and all of Trump's billionaire friends are getting richer—thanks to crypto.
Meanwhile, most retail traders are just trying to stay above water. Leverage trades are wiped out, charts feel rigged, and the market makes you feel like you're swimming against a riptide.
Why?
Because these rich guys have a plan: manipulate you and take your money. That’s how they stay rich.
Understanding their strategy is the first step to stop being their exit liquidity.
🧠 The New Battlefield
Crypto is no longer a playground for cypherpunks and tech rebels. It’s fully institutional now. We're not just trading against whales—we're fighting the same entities that own the media, control Wall Street, and write the rules.
So forget the old ways of thinking. The tables have turned.
🗓 The Sunday Rekt Routine
To maximize destruction, they need to avoid friendly fire. So they pump on the weekend when retail is free and optimistic, then dump on Monday to close the CME gap—like clockwork.
The playbook:
Weekend: Pump. Trap your long.
Monday: Dump. “Fill the gap.” Liquidate everyone.
Response:
Don’t fall for weekend FOMO. Exit Sunday afternoon. Wait until Tuesday to re-enter, once Monday’s high and low are set. Trade smart, not emotional.
📈 Top-of-the-Market FOMO
You’ve seen it before. Just before the crash, the media frenzy begins. Influencers say “Don’t miss this pump!” or “99% will miss the next big move!” The ETF gods hint at new inflows. It's a setup.
They're not hyping it for your benefit—they're offloading their bags in your face.
Just look at the charts:
BlackRock bought billions to drive BTC to 121K.
Then, in 72 hours, they dumped billions.
Saylor? Silent. No new buys. That’s not coincidence—it’s coordination.
Response:
Check the MACD, RSI, and Stochastic RSI on daily or weekly timeframes. If they're maxed out and the influencers are screaming green—it’s probably too late.
When they stop buying, the dump is already planned.
🧰 How to Outsmart Them
Watch the MACD for crossovers and divergence.
Monitor RSI zones—don’t long into extreme overbought conditions.
Use Stoch RSI to anticipate momentum shifts.
Rule: When everything is overheated, and FOMO is peaking—step back. Let them dump into each other. You’ll get your entry later, cleaner and cheaper.
⚔️ This Is War
Make no mistake: this is a war for your money.
They want yours. You want theirs.
Only the smart survive.
To be continued.
DYOR.
NEWS

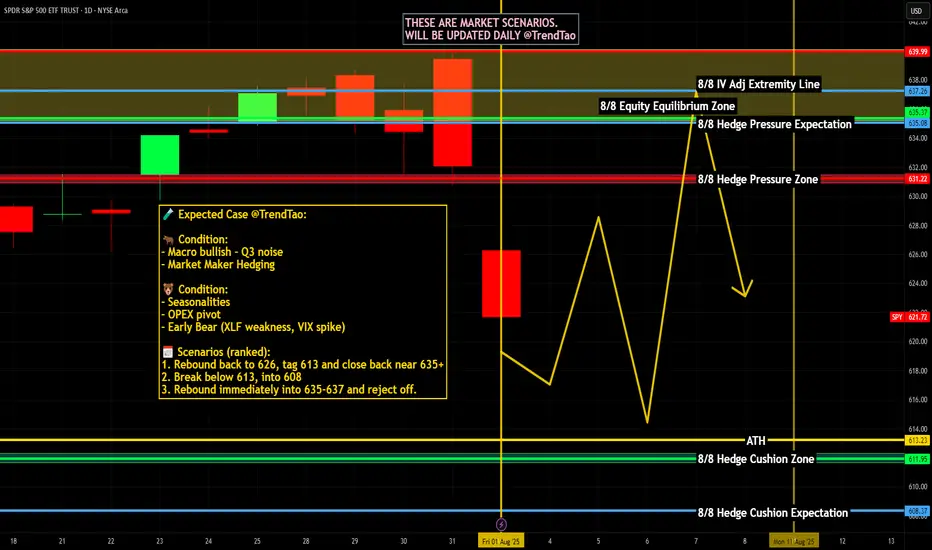
Weekly $SPY / $SPX Scenarios for August 4–8, 2025🔮 Weekly AMEX:SPY / SP:SPX Scenarios for August 4–8, 2025 🔮
🌍 Market-Moving News 🌍
📦 U.S. Tariffs Finalized as August 7 Deadline Nears
President Trump’s administration confirmed newly finalized tariff rates—ranging from 10% to over 40%—on dozens of countries, set to take effect starting August 7. The announcement has heightened global trade uncertainty and injected volatility into equity markets
📉 Weak Jobs Data Spurs Concern
July’s nonfarm payrolls came in at just 73,000 jobs added, far below expectations, while revisions to May and June data subtracted a combined 258,000 jobs. In response, the administration fired the Bureau of Labor Statistics head, escalating political risk around economic transparency
📈 U.S. Shows Resilience Amid Policy Chaos
Despite the tariff-era turbulence and labor softness, U.S. Q2 GDP rose by 3%—outperforming forecasts. Businesses racked up inventory as a hedge, absorbing initial price shocks. Still, concerns about sustained inflation pressures and waning consumer confidence linger
🎯 Earnings Week Spotlight on Tech & Industrial Names
Major companies reporting include Palantir (Monday), AMD, Uber, Disney, McDonald’s, Gilead, Pfizer, Constellation Energy, and Eli Lilly. Markets will watch for AI signals, consumer demand, and industrial trends
📊 Key Data Releases & Events 📊
📅 Monday, August 4
Factory Orders (June) — Critical for industrial demand and trade momentum.
📅 Tuesday, August 5
ISM U.S. Services PMI (July) — Thermometer for expansion in the biggest part of the economy.
S&P U.S. Services PMI (July, flash) — Preliminary signal on service-sector strength.
Trade Balance (June) — Watching for impact of tariffs and shifting cross-border flows.
📅 Thursday, August 7
Initial & Continuing Jobless Claims — Weekly labor-market readings post weak payroll report.
Productivity & Labor Costs (Q2) — Reflect business efficiency and wage trend shifts.
Wholesale Inventories (June) — Key for supply-chain and inventory cycle insights.
Consumer Credit (June) — Measures household borrowing resilience.
📅 Friday, August 8
Fed Speech: St. Louis Fed President Musalem — Market-watchers will look for cues on the near-term rate path.
⚠️ Disclaimer:
This weekly outlook is for educational and informational purposes only and should not be construed as financial advice. Always consult a licensed financial advisor before making investment decisions.
📌 #trading #stockmarket #economy #tariffs #jobs #earnings #inflation #Fed #technicalanalysis
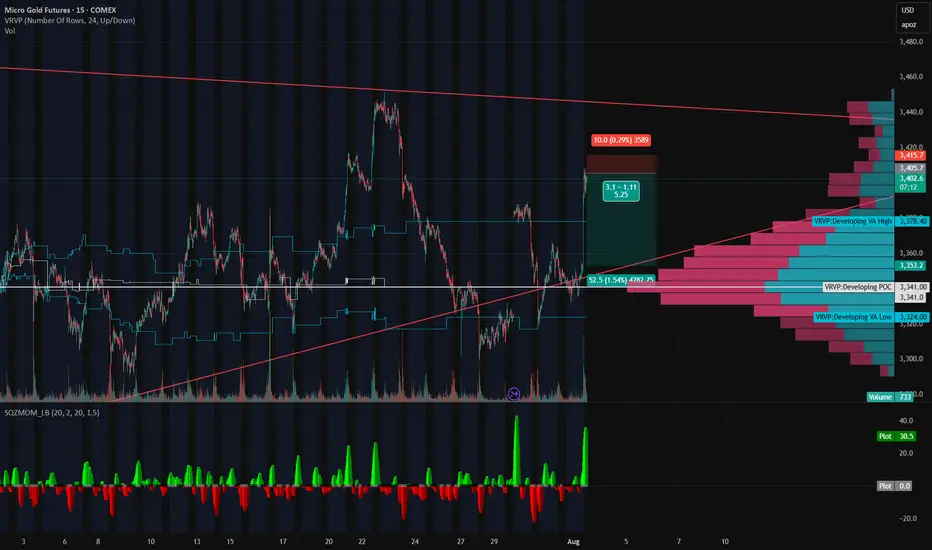
Gold’s on a Roller Coaster — and We’re Riding It Down🎢 Gold’s on a Roller Coaster — and We’re Riding It Down 🎢
Gold just snapped up like it saw Trump tweet “TARIFFS ARE BACK” — but the move smells like a knee-jerk algo pump, not real conviction. We just rejected right into a thin-volume imbalance zone and tagged the underside of a long-standing trendline.
📉 Short Setup Locked In:
💥 Entry: 3405
🛑 Stop: 3415
🎯 Target: 3353
💰 R:R ≈ 5:1
🔍 Why I'm In This Trade:
That rip? Total headline panic, not structural strength.
Low volume shelf above, with a massive POC magnet below at 3353.
We tapped the Developing VAH (3414) and got rejected — classic trap setup.
SQZMOM showing the energy is already fizzling. Green flash, no follow-through.
🧠 The Narrative:
Gold’s trying to price in volatility from every angle — Trump talk, tariffs, macro chaos — but under the hood, this pop looks unsustainable. If this is just a liquidity grab, we could see a flush back into the meat of value fast.
Grab your helmets — this roller coaster might just be heading downhill 🎢📉
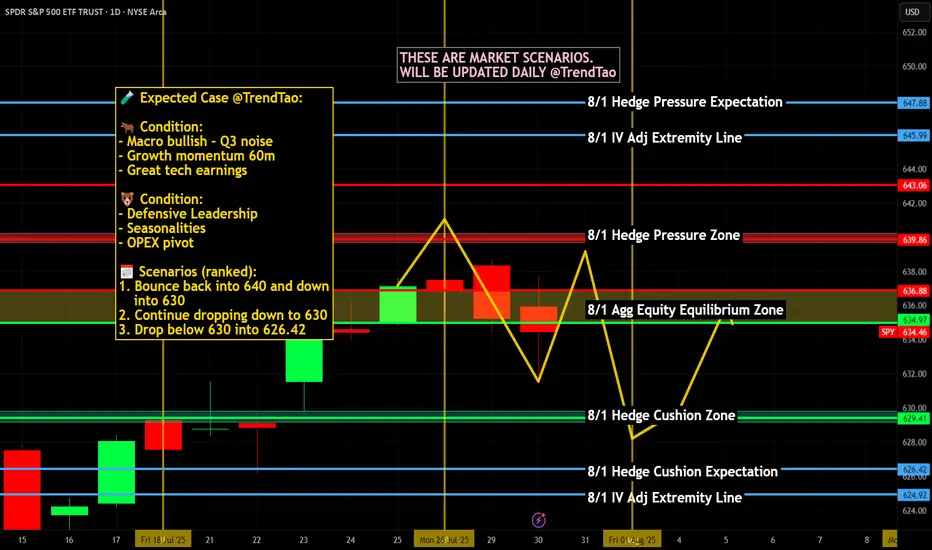
Nightly $SPY / $SPX Scenarios for August 1, 2025🔮 Nightly AMEX:SPY / SP:SPX Scenarios for August 1, 2025 🔮
🌍 Market-Moving News 🌍
📦 U.S. Imposes New Tariffs as Deadline Passes
Fresh tariffs rolled out on August 1 hitting major exporters: 25% on Indian goods, 20% on Taiwan, 19% on Thailand, and 15% on South Korea. Canadas tariff elevated to 35%, though Mexico got extra negotiation time. Global equity markets slipped modestly, led by declines in Asia-Pacific regions. AMEX:SPY futures also eased on mounting geopolitical and trade pressures.
🏦 Fed Uncertainty Mounts Despite Calm GDP
Despite robust Q2 GDP growth and a hold on interest rates this week, Fed Chair Jerome Powell faced growing unrest. Comments acknowledged downside labor risk amid trade uncertainty—investors are now assigning just a 39% chance of a rate cut in September.
📊 Key Data Releases & Events 📊
📅 Friday, August 1:
8:30 AM ET – Nonfarm Payrolls (July):
Payrolls rose by 106,000, less than June’s 147,000 but still positive. Wage growth slowed, easing inflation concerns slightly.
8:30 AM ET – Unemployment Rate:
Unemployment ticked up to 4.2%, from 4.1% in June—reflecting modest labor softness.
8:30 AM ET – Average Hourly Earnings (MoM):
Wages rose +0.2%, down from +0.4% in June, signaling wage pressure easing.
⚠️ Disclaimer:
This information is provided for educational and informational purposes only and should not be construed as financial advice. Always consult a licensed financial advisor before making investment decisions.
📌 #trading #stockmarket #economy #jobs #Fed #tariffs #inflation #technicalanalysis

Nightly $SPY / $SPX Scenarios for July 31, 2025🔮 Nightly AMEX:SPY / SP:SPX Scenarios for July 31, 2025 🔮
🌍 Market-Moving News 🌍
🏦 Fed Holds Rates — Dissent Indicates Division
The Federal Reserve maintained its benchmark rate at 4.25%–4.50%. Notably, two governors—Christopher Waller and Michelle Bowman—dissented in favor of a 25 bp rate cut, underscoring internal divisions amid growing political pressure
📈 Strong Q2 Growth, But No Rate-Cut Signal
U.S. GDP expanded at a 3.0% annualized rate in Q2, rebounding sharply from Q1's contraction. Despite this, Powell emphasized persistent inflation, particularly from tariffs, reinforcing the Fed’s cautious policy stance
🛢️ Oil Climbs as Tariff Tensions Rise
Brent crude rose to ~$73.51 and WTI to ~$70.37 on fears of supply disruptions tied to President Trump’s threats of new tariffs on Russian oil and new tariffs imposed on Brazil and South Korea
📊 Key Data Releases & Events 📊
📅 Thursday, July 31:
8:30 AM ET – Initial Jobless Claims (week ending July 26)
Initial claims rose to 222,000, up from 217,000 previously—an early gauge of labor-market trends
8:30 AM ET – Employment Cost Index (Q2)
Quarterly growth in labor costs edged lower to 0.8%, down from 0.9%—a signal of moderate wage pressures
8:30 AM ET – Personal Income (June)
Data released on household income and spending patterns—crucial for assessing consumer resilience heading into Q3
⚠️ Disclaimer:
This information is for educational and informational purposes only and should not be construed as financial advice. Always consult a licensed financial advisor before making investment decisions.
📌 #trading #stockmarket #economy #Fed #inflation #jobs #technicalanalysis
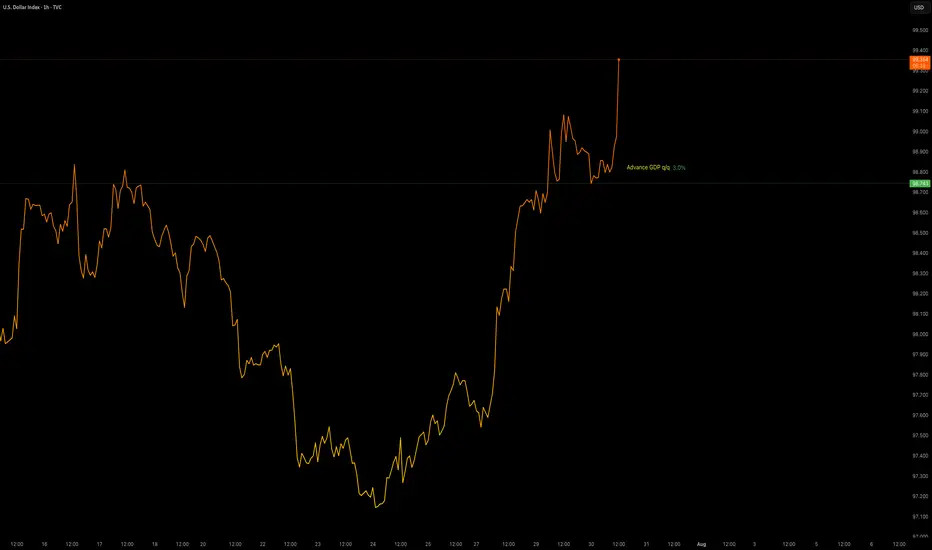
Data Release - Advance GDP q/q (3.0%)Jul 30 2025: ADVANCE GDP q/q (3.0%)
OANDA:XAUUSD sees some downside pressure with positive GDP data.
TVC:DXY gaining strength.
Volatility is increased. This data will be used with Interest Rate Decision later in the day to provide a XAUUSD insight.
Bitcoin Passes Stress TestOn July 25, 2025, Galaxy Digital executed one of the largest Bitcoin sales ever recorded: 80,000 BTC, valued at approximately $9 billion , on behalf of a Satoshi-era investor.
Despite the size, the market absorbed the flow with minimal volatility—Bitcoin dipped from around $119,000 to $115,000, then rebounded above $119,000.
Liquidity Maturity in Motion
Analysts called the trade a significant demonstration of market maturity, noting that 80,000 BTC was absorbed in days with barely a market blip.
Crypto infrastructure has also evolved: algorithmic liquidity providers, institutional desks, and OTC channels handled the load without triggering cascading funding rate hikes or forced liquidations.
Ongoing Risks
Event-Driven Stress: During macro shocks or sharp sell-offs, liquidity may thin, and the same level of absorption might not persist.
OTC vs Exchange: This large sale was managed mostly off-exchange. A similar-sized on-exchange dump could still trigger stop-run cascades.
Retail Complacency Risk: The stability seen now can be deceptive, as retail may misinterpret low volatility as a safe leverage zone, only to be caught off-guard.
Projections:
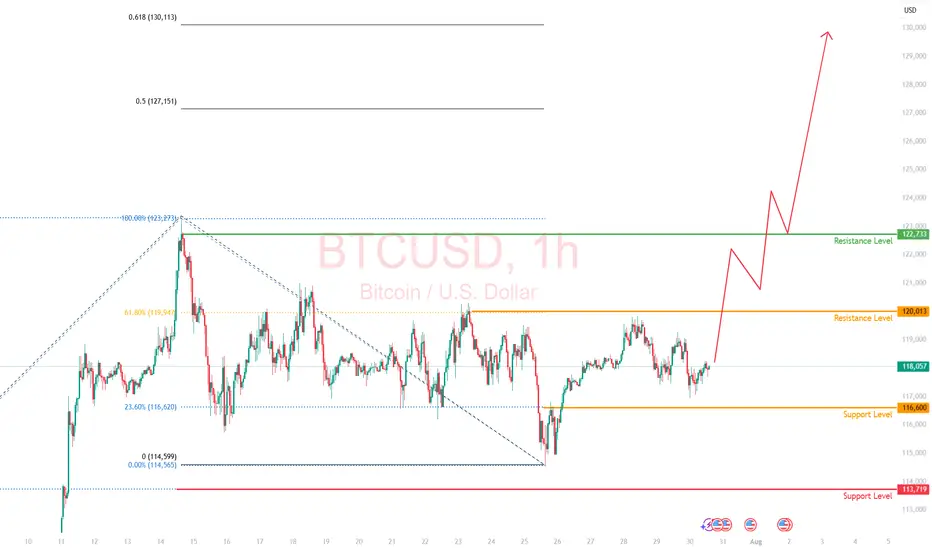
Watching the 23.6% fib retracement level in line with the $116,600 price level. Anticipate the resistance level of $120,000 to be retested.
If price breaks above $120,000, we could see a significant move toward $130,000
The $9B BTC sale went through without materially impacting price is considered a milestone in crypto market evolution. It reflects institutional-grade liquidity and sentiment maturity.
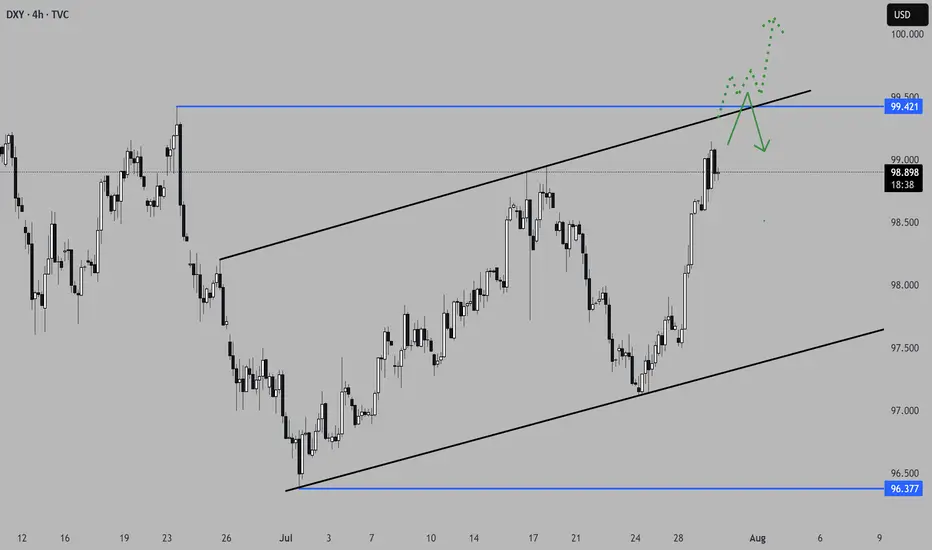
Interesting few days ahead... USD pairs approaching key levelsDXY is finishing a HTF consolidation and is approaching medium-term key areas. Other USD pairs are also in areas where they could aggressively turn around. EURUSD just finished a H4 3-touch continuation flag and is starting to stall on the 3rd touch, suggesting indecision in the markets.
Considering the news events in the next 3 days, starting today with USD advanced GDP data, we could see volatility kicking in on these key levels. We do need a catalyst to push price into a larger directional move, and we are prime positioned for the next leg. Technically, a breakout in both directions would make sense in these areas. Time to set alarms and be vigilant but not jump into trades too early, considering NFP on Friday as well.
*** **** ****
📈 Simplified Trading Rules:
> Follow a Valid Sequence
> Wait for Continuation
> Confirm Entry (valid candlestick pattern)
> Know When to Exit (SL placement)
Remember, technical analysis is subjective; develop your own approach. I use this format primarily to hold myself accountable and to share my personal market views.
The pairs I publish here are usually discussed in detail in my Weekly Forex Forecast (WFF) and are now showing further developments worth mentioning.
⚠ Ensure you have your own risk management in place and always stick to your trading plan.
*** **** ****
Nightly $SPY / $SPX Scenarios for July 29, 2025🔮 Nightly AMEX:SPY / SP:SPX Scenarios for July 29, 2025 🔮
🌍 Market‑Moving News 🌍
U.S.–EU Trade Deal Sparks Optimism
The U.S. and EU signed a trade framework allowing a 15% tariff rate on most EU imports, averting harsher penalties. The S&P 500 and Nasdaq both closed at fresh record highs, supported by upbeat tech earnings sentiment—Tesla advanced on a new $16.5B AI chip deal with Samsung—while U.S.–China trade talks resume in Stockholm.
Fed Likely to Hold Rates; Political Pressure Mounts
The Fed is expected to leave its benchmark rate at 4.25%–4.50% at the July 29–30 FOMC meeting. Chair Powell faces growing political pressure from President Trump to cut rates and concerns about central bank independence remain elevated.
Trade Talks Extension to Avoid Tariff Hike Deadline
The August 1 tariff deadline looms. Markets are watching to see if trade deals with China, Canada, and the EU extend the pause or risk new tariffs. Volume in AI/chip stocks and industrials reflects sensitivity to trade developments.
📊 Key Data Releases & Events 📊
📅 Tuesday, July 29
FOMC Meeting Begins — All eyes on Fed rate decision and updated projections.
GDP (Advance Q2 Estimate) — Expected around +1.9% on signs of economic rebound.
⚠️ Disclaimer:
This summary is for educational and informational purposes only—it is not financial advice. Always consult a licensed financial advisor before making investment decisions.
📌 #trading #stockmarket #economy #Fed #trade #tariffs #PCE #jobs #technicalanalysis

Weekly $SPY / $SPX Scenarios for July 28–August 1, 2025🔮 Weekly AMEX:SPY / SP:SPX Scenarios for July 28–August 1, 2025 🔮
🌍 Market‑Moving News 🌍
🏦 Fed Holds Steady, Faces Political Pressure
The Federal Reserve is expected to keep rates at 4.25%–4.50% during its FOMC meeting midweek. While rates are unchanged, political pressure from President Trump continues as calls intensify for rate cuts and questions arise over the Fed’s independence—including dissent from Governors Waller and Bowman.
📦 Trade Truce Extends & New Deal With EU
A new trade framework with the EU reduces tariffs to 15%, easing tensions. Meanwhile, U.S. and Chinese trade teams begin talks in Stockholm on Monday aiming to avoid an early-August tariff deadline.
💻 Tech and Mega-Cap Earnings Spotlight
This week features earnings from tech giants including Meta, Microsoft (Wednesday), followed by Amazon and Apple (Thursday). Markets will prioritize forward guidance around AI investments, capital expenditures, and sales trends.
📊 Key Data Releases & Events 📊
📅 Monday, July 28
No major releases
📅 Tuesday, July 29
Chicago PMI (July flash) – early indicator of regional manufacturing trends.
Global PMIs – flash readings for Europe and Asia gauge economic health.
📅 Wednesday, July 30
FOMC Rate Decision & Powell Press Conference – investors will scrutinize tone, forward guidance on rates, labor markets, and inflation.
Q2 U.S. GDP (Advance Estimate) – expected at ~1.9%, signaling rebound after Q1 contraction.
📅 Thursday, July 31
June PCE & Core PCE Indexes – Fed’s preferred inflation measure. Core PCE expected at ~2.7% YoY.
Consumer Confidence (July) – key for household spending trends.
Trade Balance (June) – provides data on U.S. import/export dynamics.
📅 Friday, August 1
July Nonfarm Payrolls, Unemployment & Wage Data – forecast for ~102,000 new jobs and ~4.2% unemployment; markets await for labor-market cooling signs.
Tariff Deadline – new tariffs loom unless trade agreements with EU, Canada, China etc. materialize by today’s cutoff.
⚠️ Disclaimer:
This summary is educational and informational only. It is not financial advice. Always consult a licensed financial advisor before making any investment decisions.
📌 #trading #stockmarket #economy #Fed #earnings #inflation #tariffs #GDP #PCE #jobs #technicalanalysis
Nightly $SPY / $SPX Scenarios for July 25, 2025🔮 Nightly AMEX:SPY / CBOE:SPX Scenarios for July 25, 2025 🔮
🌍 Market‑Moving News 🌍
🏔️ Copper Market Flashpoint
Following President Trump’s announcement of steep copper tariffs (15–50% range), U.S. copper futures surged, then sharply reversed. Inventory arbitrage between CME and LME markets surged, distorting pricing dynamics and triggering concern over metal market stability.
🇪🇺 EU–China Summit Signals Trade Reset
EU leaders concluded their 25th summit with China, fostering deeper economic and strategic ties. Observers expect follow-up on mutual trade agreements, particularly regarding tech and sustainability sectors.
🌍 EM Equity Rally Consolidates Gains
Emerging markets continue to outperform global equities in 2025—with MSCI EM up ~18% vs. S&P 500. Analysts highlight strong opportunities in AI/fintech stocks in China and Latin America, suggesting further rotations out of U.S. markets.
📊 Key Data Releases & Events 📊
📅 Friday, July 25:
8:30 AM ET – Durable Goods Orders (June):
Forecast shows a sharp drop (~–10%), following a ~16% gain in May—signaling possible cooling in business-related equipment purchases.
10:00 AM ET – U.S. Imports of Steel Products (June):
Trade-data release monitoring steel flows amid evolving tariff frameworks.
All Day – Corporate Earnings Reports:
Companies such as First Financial Bancorp (FFBC), HCA, AON, Charter, and others report earnings. Outlooks may influence small- to mid-cap sentiment.
⚠️ Disclaimer:
This report is for educational and informational purposes only—not financial advice. Always consult a licensed financial advisor before making investment decisions.
📌 #trading #stockmarket #economy #data #earnings #commodities #EM #technicalanalysis
Nightly $SPY / $SPX Scenarios for July 24, 2025🔮 Nightly AMEX:SPY / SP:SPX Scenarios for July 24, 2025 🔮
🌍 Market-Moving News 🌍
🤝 U.S.–EU & U.S.–Japan Trade Optimism Lifts Sentiment
The S&P 500 and Nasdaq hit record-high closes on July 23, fueled by optimism over a potential U.S.–EU trade deal mirroring the U.S.–Japan framework, with the EU-set tariff on autos potentially halved to 15%
💵 Dollar Retreats, Yields Climb
As markets shifted toward risk assets, U.S. Treasury yields increased and gold softened, while the dollar eased—highlighting growing confidence in trade-driven growth news
🏦 Fed Independence Under Pressure—But No July Cut Expected
A Reuters poll shows economists see heightened political pressure on the Fed jeopardizing its independence, though the consensus remains that rates will stay unchanged this month
📊 Key Data Releases & Events 📊
📅 Thursday, July 24:
8:30 AM ET – Initial Jobless Claims
Weekly tally of new unemployment benefit applications—key indicator of labor-market conditions.
10:00 AM ET – New Residential Sales (June)
Tracks signed contracts for new homes, offering insight into housing demand under tightening mortgage rates.
All Day – Trade Headlines & Fed Watch
Continued focus on U.S.–EU trade developments and any follow-up to Fed independence concerns from policy circles.
⚠️ Disclaimer:
This information is for educational and informational purposes only—not financial advice. Please consult a licensed financial advisor before making investment decisions.
📌 #trading #stockmarket #trade #economy #Fed #housing #jobs #technicalanalysis
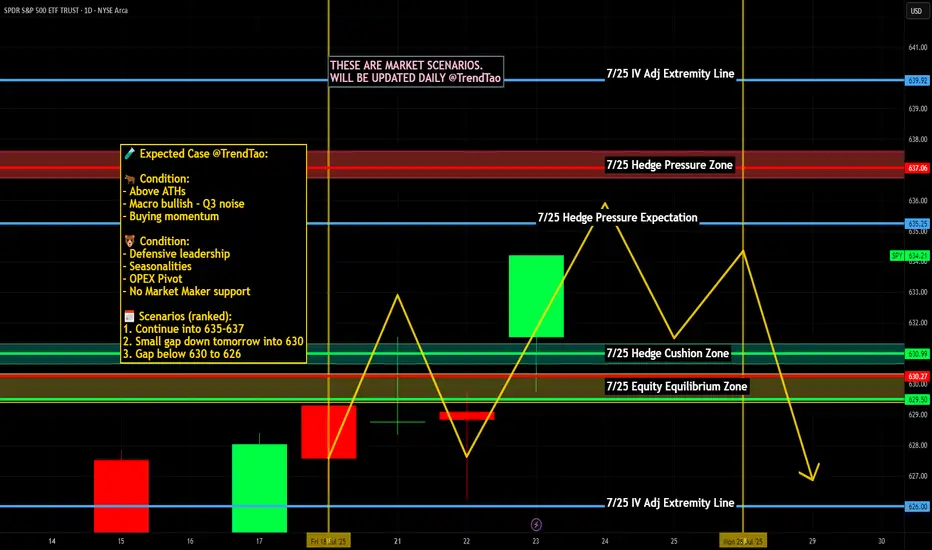
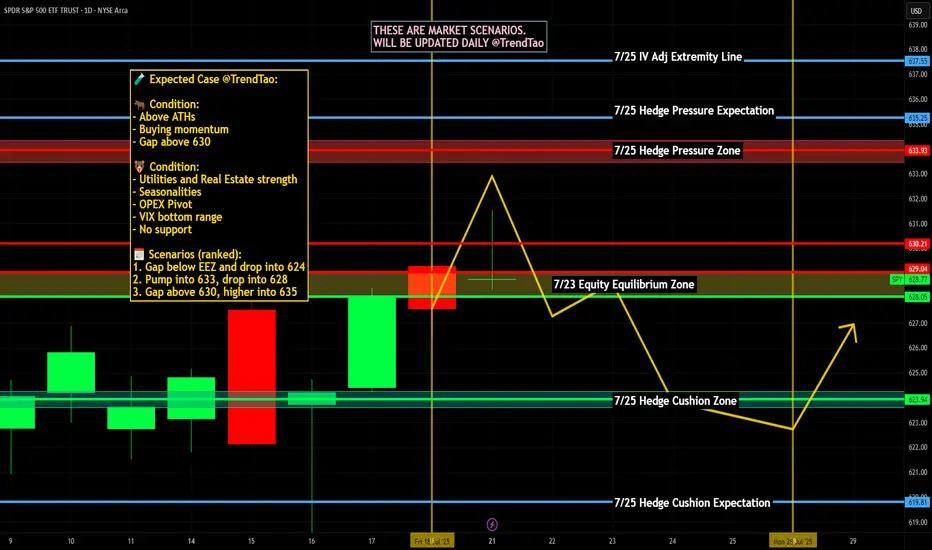
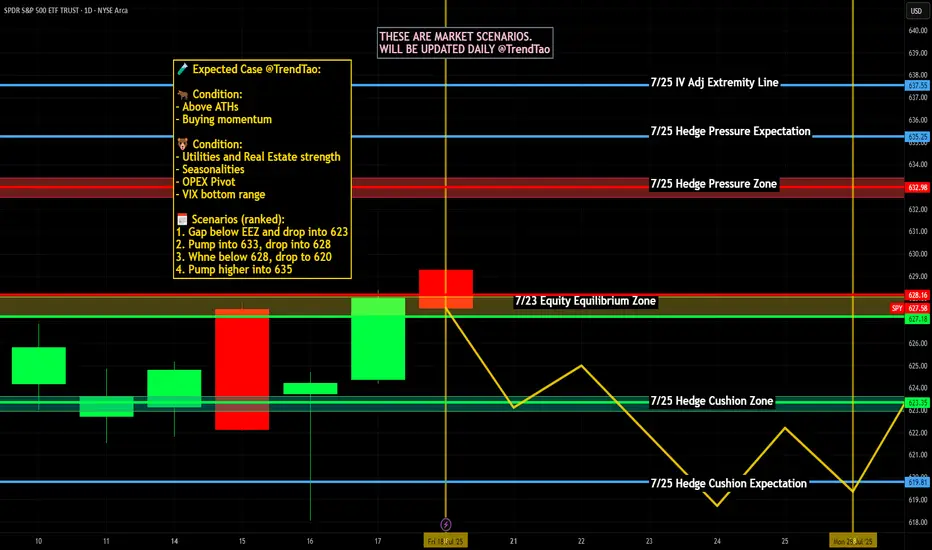
Nightly $SPY / $SPX Scenarios for July 23, 2025🔮 Nightly AMEX:SPY / SP:SPX Scenarios for July 23, 2025 🔮
🌍 Market-Moving News 🌍
📈 Morgan Stanley Stays Bullish
Morgan Stanley reaffirmed its optimistic view, forecasting the S&P 500 will reach 7,200 by mid‑2026. They cited strong earnings and anticipated rate cuts as key drivers, though warned of risks from rising Treasury yields and tariff-related cost pressure
📉 Inflation Debate Reignites
A renewed debate is underway regarding whether tariffs are "transitory" or persistent inflation drivers. Treasury counselor Joseph Lavorgna argued tariff impacts will be one-off, while others caution long-term price pressures may persist, complicating Fed policy directions
🏛️ Calls for Fed Reform Intensify
Treasury Secretary Scott Bessent suggested structural reforms to the Federal Reserve could have greater long-term impact than removing Chair Powell, highlighting ongoing concerns over central-bank governance amid political criticism
💳 Investors Shift to Corporate Bonds
As equity valuations have surged, investors are reallocating toward investment-grade corporate bonds, reducing credit spreads to the tightest levels since 1998—a sign of elevated risk appetite balanced with caution
📊 Key Data Releases & Events 📊
📅 Wednesday, July 23:
(No major U.S. economic releases)
Market focus remains on tech earnings (Tesla, Alphabet) and Fed signals following Tuesday’s Powell address.
⚠️ Disclaimer:
This information is for educational/informational purposes only and does not constitute financial advice. Please consult a licensed financial advisor before making investing decisions.
📌 #trading #stockmarket #economy #tariffs #Fed #earnings #corporatebonds
Nightly $SPY / $SPX Scenarios for July 22, 2025🔮 Nightly AMEX:SPY / SP:SPX Scenarios for July 22, 2025 🔮
🌍 Market-Moving News 🌍
🚀 Tech & EV Stocks in Focus Ahead of Earnings
Futures were quiet ahead of Tuesday’s open, but key movers included Astera Labs (+19%), Alphabet (+2.7%), Netflix +2%, and Robinhood –4.9% after being passed over for the S&P 500. Investors are positioning ahead of major tech and EV earnings this week — including Tesla, Alphabet, Lockheed Martin, Coca‑Cola, and Honeywell
📣 Powell Speech Eyed for Rate Clues
Fed Chair Jerome Powell is set to speak at 8:30 AM ET today at the Integrated Review of the Capital Framework for Large Banks Conference in D.C. Markets will be watching for any indications on future interest rate direction
🌏 Japan’s Political Shift Has Little Market Impact
Japan’s ruling coalition lost its upper-house majority over the weekend, but markets remained stable as it was largely expected. The yen held steady, and Asian equities stayed calm amid the holiday—focus remains on upcoming corporate earnings
📊 Key Data Releases & Events 📊
📅 Tuesday, July 22:
8:30 AM ET – Powell Speech: Key address at the bank regulation conference. Tone and forward guidance may sway bond and equity markets.
After Market Close – Alphabet & Tesla Earnings: Heavyweights due today—market attention will track revenue guidance, especially on advertising, EV demand, and AI.
⚠️ Disclaimer:
For educational and informational purposes only. Not financial advice—consult a licensed advisor before making investment decisions.
📌 #trading #stockmarket #tech #Fed #earnings #AI #infrastructure #volatility
Weekly $SPY / $SPX Scenarios for July 21–25, 2025🔮 Weekly AMEX:SPY / SP:SPX Scenarios for July 21–25, 2025 🔮
🌍 Market-Moving News 🌍
🏦 Fed Chair Powell Speaks — Markets Key Into Tone
Federal Reserve Chair Jay Powell’s Jackson Hole speech is the week’s centerpiece. Markets will be closely listening for clues on inflation strategy, rate-cut timing, and sensitivity to geopolitical inflation drivers like tariffs.
📦 Tariff Deadlines Gain Spotlight
Multiple tariff deadlines are set this week for targeted trade partners including the EU, Mexico, Canada, Japan, South Korea, and Thailand. Any new announcements or extensions could trigger volatility in trade-exposed sectors.
🛢️ Oil Market Mixed Signals
Brent crude prices have stabilized near mid-$70s, but OPEC+ discussions regarding supply extensions and global growth concerns continue to inject uncertainty into energy-linked equities.
📈 Big Tech Earnings Kick Off
The “Magnificent Seven” tech giants begin reporting: Nvidia leads on Tuesday, followed by Microsoft, Amazon, Alphabet, and Meta later in the week. Expect significant sentiment swings based on forward commentary.
📊 Key Data Releases & Events 📊
📅 Monday, July 21
Quiet session ahead of a packed week of speeches and data.
📅 Tuesday, July 22
8:30 AM ET – Existing Home Sales (June):
Measures signed contracts on previously owned homes—a key housing indicator.
After Market Close – Nvidia Q2 Earnings:
Market will watch guidance and China commentary.
📅 Wednesday, July 23
8:30 AM ET – Leading Economic Indicators (June):
An early gauge of U.S. economic momentum.
📅 Thursday, July 24
8:30 AM ET – Initial & Continuing Jobless Claims:
Labor-market health indicator.
📅 Friday, July 25
8:30 AM ET – Durable Goods Orders (June):
Signals demand for long-lasting goods, often driven by business spending.
8:30 AM ET – New Home Sales (June):
Follows existing home data for housing sector insight.
4:00 PM ET – Fed Chair Powell Speech at Jackson Hole:
Expect commentary on inflation, growth, and rate-path clarity.
⚠️ Disclaimer:
This content is for educational and informational purposes only and should not be construed as financial advice. Consult a licensed financial advisor before making investment decisions.
📌 #trading #stockmarket #economy #Fed #earnings #housing #durablegoods #JacksonHole #technicalanalysis
Nightly $SPY / $SPX Scenarios for July 17, 2025🔮 Nightly AMEX:SPY / SP:SPX Scenarios for July 17, 2025 🔮
🌍 Market-Moving News 🌍
🇮🇳 India–U.S. Inflation Divergence Dampens Dollar
India’s June retail inflation tumbled to a six-year low, while U.S. CPI hit its fastest pace since February—driven by tariff effects. This divergence is weakening the U.S. dollar against the rupee, pushing down dollar‑rupee forward premiums
📜 Treasury to Ramp Up T-Bill Issuance
Following the recent debt-ceiling increase, the U.S. Treasury plans to issue over $1 trillion in T-bills over the next 18 months. Money-market funds, flush with cash, are expected to absorb the supply, which could influence short-dated yields
💱 Dollar Eases Amid Fed-Related Volatility
Headline news that President Trump “highly unlikely” to fire Fed Chair Powell, coupled with stable PPI data, calmed markets. The dollar dipped slightly after earlier turmoil, while gold and bonds saw modest gains
📊 Key Data Releases & Events 📊
📅 Thursday, July 17:
(No major U.S. economic releases)
Markets will track T-bill issuance plans, dollar forward dynamics, and statements from the Treasury and Fed regarding debt and rate strategy.
⚠️ Disclaimer:
This is for educational purposes only—not financial advice. Consult a licensed financial advisor before making investment decisions.
📌 #trading #stockmarket #economy #dollar #tbills #inflation #Fed #technicalanalysis
Nightly $SPY / $SPX Scenarios for July 16, 2025 🔮 Nightly AMEX:SPY / SP:SPX Scenarios for July 16, 2025 🔮
🌍 Market-Moving News 🌍
📈 Record Bullish Sentiment Signals Rotation
Bank of America reports the most bullish fund-manager sentiment since February. With 81% expecting one or two Fed rate cuts this year, the group sees a rotation strategy replacing outright selling, with investors tipping toward sector shifts over wholesale exits
⚠️ Trump’s Fed Attacks Stir Policy Concerns
President Trump’s public criticism of Fed Chair Powell—calling for steep rate cuts and threatening removal—has raised market alarms over the central bank’s independence. Analysts warn such interference could destabilize confidence in U.S. monetary policy
🏦 Banks Prepare for Earnings Surge
Major U.S. banks are expected to report strong Q2 results this week. Enhanced trading and investment banking revenues are forecasted to offset economic uncertainties tied to tariffs
📡 Nvidia CEO to Visit Beijing
Jensen Huang is set to hold a high-profile media briefing in Beijing on July 16, signaling continued emphasis on China for Nvidia despite U.S. export restrictions—potentially a key narrative for tech markets
📊 Key Data Releases & Events 📊
📅 Wednesday, July 16:
8:30 AM ET – Producer Price Index (June)
Gauges wholesale inflation pressures; June expected +0.2% MoM vs May’s +0.1%
9:15 AM ET – Industrial Production & Capacity Utilization (June)
Monitors factory and utilities output and usage rates—key for industrial-sector health
Jensen Huang in Beijing
Nvidia CEO to lead media briefing in Beijing—a potential market mover for chipmaking and AI sectors
⚠️ Disclaimer:
This info is for educational purposes only—not financial advice. Consult a licensed professional before making investment decisions.
📌 #trading #stockmarket #inflation #Fed #tech #industrial #PPI
Nightly $SPY / $SPX Scenarios for July 15, 2025🔮 Nightly AMEX:SPY / SP:SPX Scenarios for July 15, 2025 🔮
🌍 Market-Moving News 🌍
📦 Dow Futures Dip on New Tariff Announcements
President Trump announced new 30% tariffs on EU and Mexico, with additional duties on Japan, South Korea, Malaysia, Kazakhstan, South Africa, Laos, and Myanmar starting August 1. Dow, S&P, and Nasdaq futures each slipped ~0.3% as markets assess inflation risk ahead of key CPI data this week
📈 Tech & AI Stocks Lead Despite Tariffs
Stocks like Circle (+9.3%), CoreWeave (+5.2%), Palantir (+5%), Roblox (+5.8%), and Shopify (+4.1%) surged, showcasing sector resilience amid broader tariff fears
⚠️ Deutsche Bank Warns of Summer Volatility
With thin market liquidity and rising geopolitical tension (tariff deadline Aug 1), Deutsche Bank flags summer as a period prone to sudden corrections
📊 Key Data Releases & Events 📊
📅 Tuesday, July 15:
8:30 AM ET – CPI (June)
Core CPI is projected at +0.3% MoM (2.7% YoY) and headline CPI +0.3% MoM—signs tariff effects may be feeding into prices
8:30 AM ET – Core CPI (June)
Expected to come in around 3.0% YoY.
8:30 AM ET – Empire State Manufacturing Survey (July)
Forecast: –7.8 (less negative than June’s –16.0) — a modest sign of stabilizing factory conditions
Fed Speakers Throughout the Day
Watch for commentary from Fed officials (Michael Barr, Barkin, Collins, Logan) for fresh insights on inflation and monetary policy
⚠️ Market Interpretation:
Inflation Watch: A hotter-than-expected CPI could delay anticipated rate cuts and lift yields. A pick-up in core CPI above 3% would be a red flag.
Growth Signals: A less-negative Empire State reading may suggest improving industrial momentum but still signals contraction.
Political Risk: Tariff escalation could shift investor appetite, even if markets right now are focusing on broader macro narratives.
Volatility Setup: The combination of thin liquidity, tariff uncertainty, and critical data makes for a potentially choppy week.
📌 #trading #stockmarket #economy #inflation #tariffs #Fed #CPI #manufacturing #technicalanalysis

BTC/USDT HIDDEN PATTERN! SM, FIB AND MORE COMFIRMED!Price Resilience Amid Geopolitical Stress
Bitcoin demonstrated remarkable strength during the Israel-Iran conflict, briefly dipping to ~$98K but swiftly rebounding above $105K. This aligns with historical patterns where BTC initially sells off on geopolitical shocks but recovers aggressively within weeks, outperforming gold and equities by 15-60% post-crisis. There is a $96K-$94K "footprint" that coincided with institutional accumulation, evidenced by $1.37B in spot ETF inflows during the conflict week, led by BlackRock's IBIT ($240M single-day inflow) according to official information. This institutional backstop and many others might single-handedly prevented a deeper correction for now, remember that smart money psychology is to create cause out of thin air and buy during selling and indecisive times.
Critical Levels to Watch
Immediate Support: $108k area is vital. A sustained hold here maintains short-term bullish momentum. The 50-day SMA near $102.8K (tested during June 13 conflict sell-off) remains a macro support floor.
Resistance & Targets: The $112K ATH is the near-term ceiling. Breaking this requires stronger spot demand—currently, net exchange inflows are negative, indicating weak retail participation or traders that are backing off for now.There's a $120K target (0.618 Fib) aligned with Standard Chartered’s $150K year-end model if ETF inflows persist.
Risk Zones: A close below $108.3K risks a slide to $105K. Failure here opens path to $96K and a further break of this 92k to 96k zone could lead directly to 70k area or even lower if economical and social activities are not favorable in the near to medium future.Dominance above 55% (currently 65%) delays alt season, but a break below 60% could ignite alts in a positive way.
Macro Catalysts & Market Sentiment
Policy Tailwinds: Trump’s "One Big Beautiful Bill" (proposing $5T debt ceiling hike and U.S. strategic BTC reserves) could weaken the USD, boosting BTC’s "digital gold" narrative. DXY’s -9% YTD drop already correlates with BTC’s 54% post-election rally.
Fed Influence: Pressure to cut rates (amid cooling employment data) may accelerate institutional rotation into BTC. ETF inflows hit $2.75B in late June, signaling renewed institutional FOMO.
Geopolitical Cooling: Iran-Israel ceasefire talks reduced immediate panic, but residual volatility risk remains. Traders note BTC often rallies 20-40% within 60 days of conflict events.
Structural Challenges
Liquidity Fragility: Whale moves (for example: 10K BTC sell orders) now impact prices more due to ETF-driven liquidity concentration. Recent $98K flash crash exemplified this.
Regulatory Overhang: MiCA compliance costs in the EU and U.S. security-reclassification proposals could pressure smaller tokens, though BTC’s status appears secure 28.
Seasonal Slump: July historically sees 6.1% of annual crypto volume—low volatility may delay breakouts until August 4.
Strategic Outlook
A July breakout above $112K could ignite the next leg to $120K, but a retest of $107K-$105K is likely first. Altcoins remain subdued until BTC dominance breaks <55%—select projects with institutional backing (for example, ETF candidates) or real-world utility for asymmetric opportunities.
Conclusion: BTC’s resilience amid chaos confirms its institutional maturity. Trade the $108.3K-$112K range aggressively, with a break above ATH targeting $120K by September. Always hedge tail risks (escalations, regulatory shocks) in this volatility-rich asset class. While this great surge in institutional inflow is good for BTC it also indicates a reduction or slower pace of other crypto currencies.
This is my analysis for BTC, let me know what you think and I hope you like it!

Weekly $SPY / $SPX Scenarios for July 14–18, 2025🔮 Weekly AMEX:SPY / SP:SPX Scenarios for July 14–18, 2025 🔮
🌍 Market-Moving News 🌍
⚖️ Powell Faces ‘Epic’ Trade‑Inflation Dilemma
Former Fed economists warn Chair Powell is navigating nearly unprecedented terrain: tariffs are pushing up prices even as the labor market cools. Striking a balance between inflation control and growth support remains a formidable challenge
📊 Tariff‑Driven Inflation May Peak This Week
June’s CPI is expected to show a 0.3% month-on-month increase, potentially lifting core inflation to ~2.7%—its highest level in 18 months. These data will heavily influence the Fed’s decision-making process
🏦 Big Bank Earnings Kick Off
Earnings season begins with JPMorgan ( NYSE:JPM ), Goldman Sachs ( NYSE:GS ), Wells Fargo ( NYSE:WFC ), and Citigroup ($C) reporting. Strong results could offset trade and inflation anxieties; expect volatility in financials
📈 Goldman Sees Broader S&P Rally
Goldman Sachs projects the S&P 500 to climb roughly 11% to 6,900 by mid‑2026, underpinned by firm earnings and expected Fed rate cuts. But warns that breadth remains narrow, increasing downside risk without robust participation
⚠️ Summer Volatility Risk Lingers
Deutsche Bank warns that summer’s low liquidity and the looming Aug 1 tariff re‑imposition deadline may spark sudden market turbulence—even amid bullish sentiment
📊 Key Data Releases & Events 📊
📅 Monday, July 14
Quiet start—markets digest back-to-back CPI, tariffs, and clearing post‑earnings.
📅 Tuesday, July 15
8:30 AM ET – Consumer Price Index (June)
Watch for potential tariff impact in CPI; core inflation data are crucial.
8:30 AM ET – Core CPI (June)
10:00 AM ET – Empire State Manufacturing Survey (July)
Early view on Northeast factory trends.
📅 Wednesday, July 16
8:30 AM ET – Producer Price Index (June)
Wholesale inflation signals to validate CPI trends.
10:00 AM ET – Housing Starts & Building Permits (June)
📅 Thursday, July 17
8:30 AM ET – Initial & Continuing Jobless Claims
A gauge on labor-market resilience amid talks of cooling.
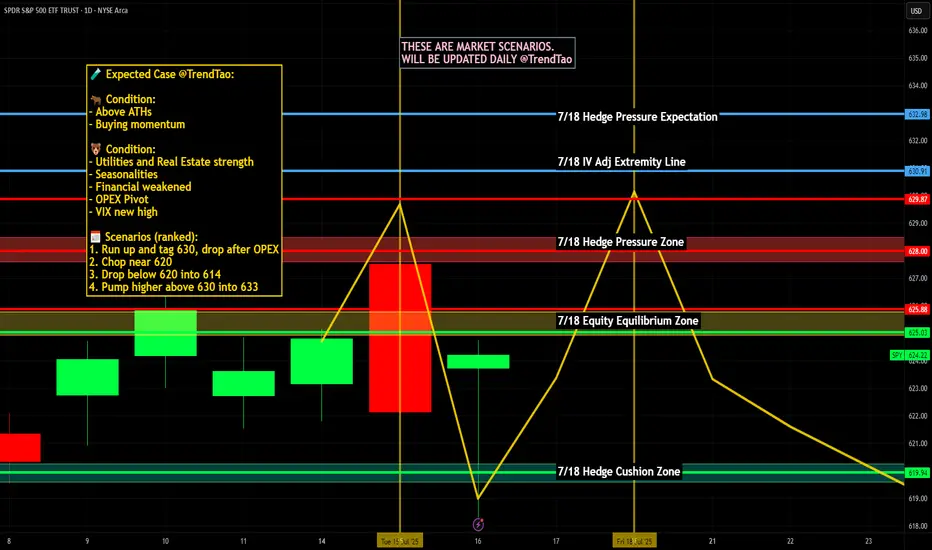
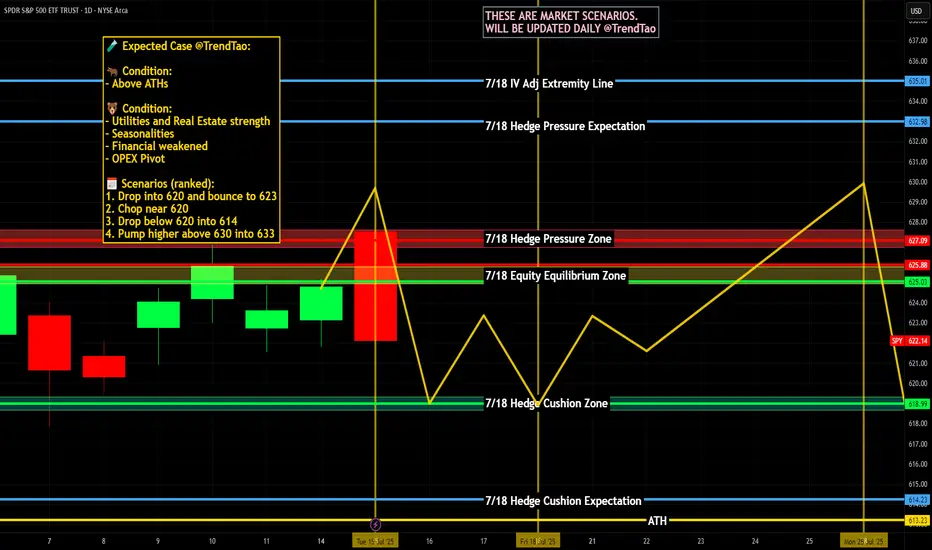
📅 Friday, July 18
10:00 AM ET – Federal Reserve Beige Book Release
Fed’s regional economic snapshot ahead of next FOMC.
⚠️ Disclaimer:
This is for educational/informational use only—not financial advice. Consult a licensed professional before investing.
📌 #trading #stockmarket #economy #tariffs #inflation #earnings #Fed #CPI #technicalanalysis

EURGBP - Follow The Bulls!Hello TradingView Family / Fellow Traders. This is Richard, also known as theSignalyst.
📈EURGBP has been overall bullish trading within the rising channel marked in blue. And it is currently retesting the lower bound of the channel.
Moreover, the orange zone is a strong daily support.
🏹 Thus, the highlighted blue circle is a strong area to look for buy setups as it is the intersection of the lower blue trendline and support.
📚 As per my trading style:
As #EURGBP approaches the blue circle zone, I will be looking for bullish reversal setups (like a double bottom pattern, trendline break , and so on...)
📚 Always follow your trading plan regarding entry, risk management, and trade management.
Good luck!
All Strategies Are Good; If Managed Properly!
~Rich
Disclosure: I am part of Trade Nation's Influencer program and receive a monthly fee for using their TradingView charts in my analysis.

Nightly $SPY / $SPX Scenarios for July 11, 2025🔮 Nightly AMEX:SPY / SP:SPX Scenarios for July 11, 2025 🔮
🌍 Market-Moving News 🌍
🏦 Strong Bank Earnings Amid Tariff Churn
Next week’s Q2 forecasts point to robust earnings from U.S. banks—JPMorgan, Citi, Bank of America, Goldman Sachs, Morgan Stanley, and Wells Fargo—as trading and investment-banking revenue recover, offsetting uncertainties from ongoing tariffs
💬 Dimon Flags Fed Risk Pricing
JPMorgan’s Jamie Dimon cautioned that markets may be underestimating upside in interest rates. He sees a 40–50% probability of higher U.S. rates, driven by inflation from tariffs, migration, and fiscal deficits
⚖️ Tariff “Scattergun” Sparks Sector Disconnect
Trump’s plans to levy up to 200% tariffs on pharma and 50% on copper triggered uneven market reactions—copper prices rose 30% in six months, while European drugmakers remain flat, highlighting divergent sector sensitivities
📉 Tech & Macro Still Bullish
Despite policy turbulence, Nvidia climbed back above a $4 trillion valuation, and JPMorgan projects a $500 billion inflow into equities in H2—supporting gains even as broader macro pressures linger
📊 Key Data & Events
📅 Friday, July 11:
(No major U.S. economic data scheduled)
Markets will focus on bank earnings previews, tariff headlines, and the hold of the tech rally into a thin summer trading week.
⚠️ Disclaimer:
This information is for educational and informational purposes only and should not be construed as financial advice. Always consult a licensed financial advisor before making investment decisions.
📌 #trading #stockmarket #economy #tariffs #banks #tech #Fed #investing

Nightly $SPY / $SPX Scenarios for July 10, 2025🔮 Nightly AMEX:SPY / SP:SPX Scenarios for July 10, 2025 🔮
🌍 Market-Moving News 🌍
🏦 Global Banks Profit from Tariff Volatility
Major banks like JPMorgan, BofA, and Citigroup are expected to see ~10% growth in trading revenue in Q2, fueled by volatility from President Trump’s tariff policy shifts. Treasury trading volumes hit record highs as markets priced in policy swings
📈 S&P 500 Nears Lull Amid Bull Market Strains
Despite record highs in 2025, investors are warning that the rally may be reaching its limit. Bullish sentiment is strong, but analysts caution that sluggish consumer spending, rising inflation from tariffs, and few rate-cut signals from the Fed could cap downside momentum
🐻 Bear Case Gains Ground
Stifel’s Barry Bannister projected a potential ~12% correction in the second half of 2025. Key risks include slowing consumer spending, weak capital investment under tariff uncertainty, and persistent core inflation above 3%, negatively impacting earnings and growth outlooks
⚖️ “One Big Beautiful Bill” Could Add Trillions in Debt
The new fiscal package signed July 4 will add $3–4 trillion to national debt over the next decade while extending tax cuts and revising EV incentives. Bond market and Fed policy implications may become more pronounced if growth fails to keep pace
📊 Stocks vs Bonds: Diverging Signals
While equities climb and megacaps extend gains, Treasury yields have risen five days straight—signaling growing caution over real growth prospects. The yield curve steepening hints at mixed signals: growth optimism in stocks, but bond market signaling economic risk ahead
📊 Key Data & Events
📅 Thursday, July 10:
No major scheduled economic releases. Markets remain driven by tariff headlines, bank earnings reactions, and evolving Fed signals.
⚠️ Disclaimer:
This is for informational and educational purposes only—not financial advice. Consult a licensed advisor before making investment decisions.
📌 #trading #marketvolatility #tariffs #banks #Fed #debt #technicalanalysis
