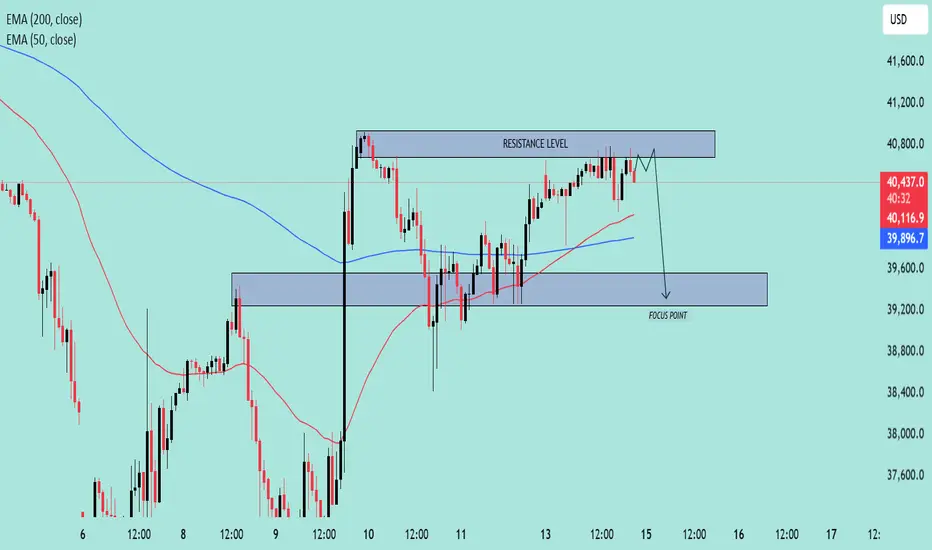
US30 Approaching Key Resistance–Potential Reversal Setup in Play🧠 Chart Overview
Asset: US30 (likely the Dow Jones Industrial Average)
Timeframe: Appears to be 1H or 2H
Indicators:
EMA 50 (Red): 40,119.5
EMA 200 (Blue): 39,897.3
Price at time of chart: Around 40,503
🔍 Key Technical Levels
🔴 Resistance Zone
Range: ~40,750 to 40,850
Price has tested this level multiple times and is currently hovering near it.
The resistance is holding, and no strong breakout has occurred.
🟦 Support / Focus Zone
Range: ~39,200 to 39,600
Marked as the “FOCUS POINT” – likely the expected target on a breakdown.
EMAs Insight:
Price is above both the 50 EMA and 200 EMA, suggesting short-term bullishness.
However, since it’s stalling at resistance, it could flip bearish on rejection.
🧭 Price Action Narrative
The chart suggests a potential fakeout above resistance, followed by a sharp rejection.
The path drawn shows a short-term dip, targeting the FOCUS POINT (support zone).
Rejection at resistance aligns with typical distribution behavior.
📌 Trade Idea (Bearish Bias)
Entry Idea: Short near or just above the resistance level (~40,800)
Target: 39,400 zone
Stop-Loss: Above the resistance level (~40,900+)
Risk/Reward: Favorable if price fails to break above resistance convincingly
📉 Bias: Bearish Reversal
Unless price breaks and closes above resistance with strong momentum, the chart favors a pullback scenario.
Newssetup
DXY (U.S. Dollar Index) Bearish Outlook – Key Levels & PredictioDXY (U.S. Dollar Index) Analysis – Daily Chart
🔹 Recent Downtrend:
The DXY has been in a strong decline ⬇️ after breaking key support around 104.5 📉.
The price dropped sharply, showing bearish momentum 🚨.
🔹 Key Zones Identified:
Resistance Zone (104.0 – 105.0) ❌📊 (Previously support, now acting as resistance)
Support Zone (100.5 – 101.0) ✅📉 (Potential target for further downside)
🔹 Expected Price Movement:
A possible short-term bounce 🔄 back toward the 104.0 - 104.5 resistance ⚠️.
If rejected ❌, the downtrend may continue toward the 100.5 – 101.0 level 🎯📉.
🔎 Conclusion:
✅ Bearish Bias – Trend favors further downside unless the price reclaims 105.0.
📌 Watch for a retracement before another drop 📉.
📊 Key Levels:
Resistance: 104.0 – 105.0 🚧
Support: 100.5 – 101.0 🛑

XAU/USD 4H Analysis: Key Support, Resistance & Breakout TargetsKey Levels Identified:
Support Zone (~2,875-2,885) 🟣
This is a strong area where price previously bounced.
If price falls below this level, it could drop further toward the next support.
Resistance Zone (~2,915-2,925) 🟣
Price is currently consolidating around this level.
A breakout above resistance could push the price toward the target.
Target (~2,950) 🎯
If the price breaks above resistance, the next key level is around 2,950.
Potential Scenarios:
📈 Bullish Scenario:
If price breaks above resistance, expect an upward move toward the target (2,950).
Confirmation would come with strong volume and bullish candlestick patterns.
📉 Bearish Scenario:
If price fails to hold above support, a drop toward 2,825-2,835 is possible.
A strong bearish candle closing below support would confirm this move.
Current Trend:
The price has been moving in a sideways consolidation between support and resistance.
Watch for a breakout in either direction for the next big move.

GBP/JPY Potential Bullish Breakout – Key Levels to Watch:
📉 Descending Trendline Breakout Setup
The price has been in a downtrend, following a descending trendline.
It is currently testing this trendline with signs of potential breakout.
📊 Key Support & Resistance Zones
Support Zone (~187.5 - 189.0): Price has bounced multiple times from this area.
Resistance Zones (~192.5 & ~200.0): First target is around 192.5, then 200.0 if momentum continues.
📈 Possible Bullish Scenario
If price breaks the trendline and holds above 192.5, we could see an upward push towards 200.0.
The expected move follows the drawn path: breakout → retest → continuation.
⚠️ Risk Factors
If the price fails to break above 192.5, it might return to the support zone.
A break below 187.5 would invalidate the bullish outlook.
Overall, this setup suggests watching for a breakout confirmation above resistance before entering long trades. 🚀

U.S Dollar Index (DXY) Rising Wedge Potential Reversal !!U.S. Dollar Index (DXY) on a 2-day timeframe, a rising wedge pattern. Here’s a breakdown of the technical analysis:
Key Observations:
1. Rising Wedge Pattern:
The price has been following an upward trajectory within two converging trendlines.
A rising wedge is typically a bearish reversal pattern, meaning a breakdown could lead to a decline.
2. Recent Price Action:
The index has recently dropped from its recent high near 108.107 and is now trading at 107.807.
This suggests that selling pressure is increasing.
3. 200 EMA Support:
The 200-period Exponential Moving Average (EMA) is currently at 104.510.
This is a key support level—if the price breaks down from the wedge, it may test the 200 EMA.
4. Potential Scenarios:
Bearish Breakdown:
If DXY breaks below the lower wedge trendline, the index could drop toward the 104.5-105.0 level (200 EMA).
A further breakdown may lead to a decline toward 102-100 levels.
Bullish Continuation:
If DXY bounces from current levels and reclaims the upper wedge resistance, it could push toward 110-112.
However, this is less likely given the wedge structure.
Conclusion:
The chart suggests a potential reversal in DXY.
A breakdown from the rising wedge could lead to a decline toward 104-105.
If bulls regain strength, DXY may attempt to push higher, but upside is limited.
Traders should watch for confirmation of a breakdown or bounce before making decisions.
