AUDNZD H4 chart long signalAUDNZD price come close to a support level. I think if it reach the support zone, it will turn around.
Newzealand

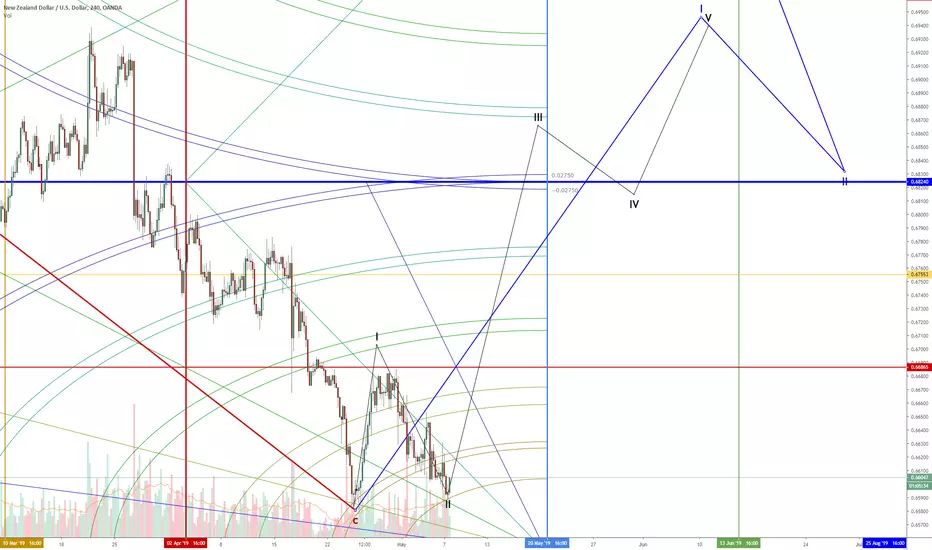
NZDCHF SHORT: Bearish Bat
just shorted nzdchf.
completed bearish bat pattern.
T1 - 0.6493
T2 - 0.6473
Stop - 0.656

Overall view of NZDUSD - Update of June 24th weekOdds of a bull continuation are high as prices pursue their way to the resistance zone. However we could experience a pullback or reversal, in fact the resistance area rejected many upside breakout attempts.
Possible targets: @0.66800 (+30pips).
Advice: Stay bullish and buy at any low point while we don't break the 0.66000 bottom level.

New Zealand Starting To Wake UpGood morning all.. as you see on the chart H4, this pair NZD USD still on the uptrend channel area. Can be bullish continue..


EURNZD | Short-Term BuyBlue box/buy box criteria:
1. ABC Equal waves point C
2. Fibonacci retracement 38%
3. Previously worked support
4. Channel projection
5. Fibonacci Extension 127%
6. Round number 1.70000
7*. 4H EMA200 just below the box (1.69817)
8*. 2012 High below the support (1.69739)
9. To be more secure and if the price falls lower than the marked box then wait for bullish candlestick patterns from the EMA and from the 2012 high level.
"If you asked me to distill trading down to its simplest form, I would say that it is a pattern recognition numbers game. We use market analysis to identify patterns, define the risk, and determine when to take profits. The trade either works or it doesn’t."
– Mark Douglas
Feel free to support my idea post by hitting the "LIKE" button, it is my only fee from You!
Have a nice day,
Cheers!

Continuation trade (5/29/2019)The chart says it all, really. As long as there are no weird Brexit stories, I am confident in this trade.
FX:GBPNZD

NZDUSD 250+ pip trade based on GannGann's 'Death Zone' is a 49-day cycle (7 days x 7 weeks = 49 days). It's shocking how many times a 49-day cycle can reverse a market. So it is no coincidence that the speed that the NZDUSD pair has dropped and has come into a major confluence zone of change. The highest probability move here is one higher - small probability of a continuation move lower. The Optex Bands are in a definite oversold condition on the daily chart. The 4-hour chart shows that the NZDUSD is primed for a push higher with the RSI being in a support zone and the Composite Index sloping higher and about to cross above its averages. Extremely bullish here.
NZDUSD TRADING PLAN
pair is testing a significant structure support level.
bullish breakout of a falling channel, inside which the price is coiling,
will trigger a buying reaction of market participants and will drive the market
all the way up to horizontal resistance.
YOUR PLAN FOR NZDUSD:
buy only after bullish breakout
T1 - 0.672
T2 - 6.676

GBPNZD STRUCTURE ANALYSIS
bulls continue pushing the market upwards.
key levels of resistance on focus:
1.198
2.00
the first significant support for the market:
1.96

NZDUSD - Look Out BelowNZDUSD has come under recent pressure after a slew of recent economic data indicating a slowing economy. With the cooling of the labour market, tepid wage gains, and poor employment data, there is chatter of the Reserve Bank of New Zealand cutting rates. This would put further pressure on the New Zealand Dollar, especially in the face of a rising USD
As a result, we see NZDUSD going lower to 0.65 over the next few weeks

EUR/NZD
Great profits made this morning after last nights spike.
This came after the NZ data showed inflation.
I will start posting more as soon as I place these trades, last nights NZD was just a quick trade with proper risk management.

EURNZD PossibilityExpecting 1.66 Soon, If momentum stay strong then can go even to 1.655 but afterward that it will start climbing .


Short-Term Long, Long-Term ShortWhile a number of technicals point to a bit of an upside trend, this should be limited by short-term resistance followed by a correction back to the long two-year channel that has formed. Daily FX's Nick Cawley called this the trade of the year to short this pair. So far its not panning out. For more, check out www.anthonylaurence.wordpress.com

EURNZD tanks to 4-month lowBy Andria Pichidi - November 15, 2018
The Kiwi is doing extremely good the past month, and more precisely after the inflation release on October 16, above expectations at 0.9% in Q3 after the 0.4% q/q rise in Q2. Recently the employment gain on November 7, was well in excess of projections, while the drop in the jobless rate was contrary to projections for a tick higher, supported New Zealand Dollar further, especially due to the global uncertainty, in the political,/geopolitical or even trade front.
Today meanwhile, the backdrop of mostly firmer stock markets in Asia, and a rise in US Equity index futures, were also a bullish lead for the relatively higher beta antipodean currency. Outperforming the Euro, at a time in which the Europe remains fraught with risks, as the brinkmanship between Italy and the EU in terms of the budget continues to play out, Brexit uncertainty remains and there are signs of flagging economic growth momentum in the Eurozone.
EURNZD continue its strong way down and broke today 4-month low at 1.6567 . This breakout below the 1.6630 Support level, was a key move in the long term, as it represents the 38.2% Fibonacci retracement since 2017 low but also strong 6-month Support between November 2017- April 2014, before the rebound of the pair up to 1.7900 area. Therefore, as the pair moves for the 3rd consecutive week strongly to the downside, ready to complete 3 black weekly craws, simply adds to the constant deterioration in the outlook.
Taking into consideration the constant declines of the price but also on momentum indicators, the pair remains strongly to the bearish outlook, without nearterm corrections signs yet.
In the weekly basis, the RSI is at 35 looking to the downside, following a smooth negative slope since Octiber. MACD lines are decreasing to the downside below signal line, confirming the increase of negative bias. In the daily chart, RSI looks oversold. However, the bearish crossover of 20-day SMA to 200-day SMA, and as the MACD keeps extending to the downside, suggest that bears have the ultimate control.
The break of 4-month low, opened today the doors for the 1.6235-1.6360 area , set at the latest swing lower ( November 2017) and the 50% Fibonacci retracement level. Further gains could then target the 61.8% Fib. level at 1.5830.
However, as the pair remains in a sharp bearish price action, a clear reversal to the upside could only be confirmed with a move above the confluence of 50-week SMA, 20-day SMA and 23.6% Fib. level at 1.7100- 1.7170 area . This could open the doors for the continuation of the uptrend again.
As mentioned, in a wider picture, the pair remains in a bearish trend, while it confirmed 5 Elliott waves movements and it currently formed a corrective wave to the downside.
Daily chart: www.screencast.com
Click here to access the HotForex Economic Calendar
Andria Pichidi
Market Analyst
HotForex
Disclaimer: This material is provided as a general marketing communication for information purposes only and does not constitute an independent investment research. Nothing in this communication contains, or should be considered as containing, an investment advice or an investment recommendation or a solicitation for the purpose of buying or selling of any financial instrument. All information provided is gathered from reputable sources and any information containing an indication of past performance is not a guarantee or reliable indicator of future performance. Users acknowledge that any investment in FX and CFDs products is characterized by a certain degree of uncertainty and that any investment of this nature involves a high level of risk for which the users are solely responsible and liable. We assume no liability for any loss arising from any investment made based on the information provided in this communication. This communication must not be reproduced or further distributed without our prior written permission.

NZDUSD Asks You Kindly to Buy Oscillators and exponential moving averages suggest a buy. If you're a trend trading, this one is an obvious long. Short when price action meets downward sloping resistance.
Find more of my analysis with more words at www.anthonylaurence.wordpress.com

how to trade harmonic abcd pattern with confirmation
hey traders,
on these charts we have a perfect example of trading harmonic abcd pattern with confirmation.
first of all, on a 4h chart we have a completed abcd pattern, the completion point of the pattern
matches perfectly with the structure looking left.
however, two high momentum bullish candles on 4h chart make me look for a confirmation signal before taking action.
though, one of the confirmation signals can be the overbought rsi on 4h chart,
I am focused on the potential double top and bearish violation of a local support level on 30M chart to sell the market.
such strategy helps to avoid losing trades when the market is very bullish or bearish,
and easily breaks a row of supports or resistances.
good luck!

NZDUSD - Pennant Formation - BUYThe NZDUSD is forming a pennant formation on the Daily candles and is pushing towards the top level at 0.6890.
A break above the pennant could see it rise the 0.6930 and then 0.6966.
There is no major fundamental news events coming from NZ this week.
