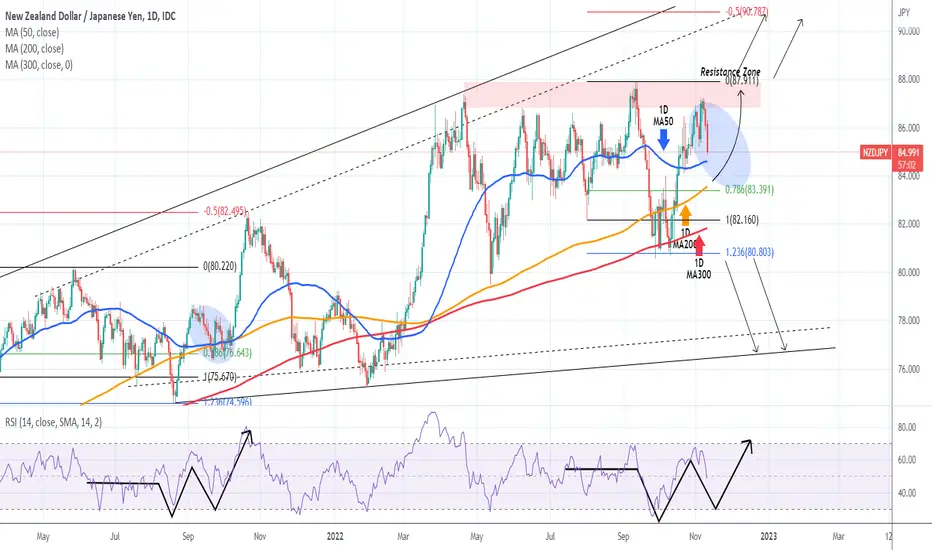
NZDJPY Pull-back first, 88.000 - 90.000 later.The NZDJPY pair followed very closely the trading plan we presented on our last September 22 analysis:
As you see after a drop to the 1.236 Fibonacci extension, the price rebounded aggressively back to the Resistance Zone. What helped us make this accurate projection were the striking similarities that presented early on with the June - September 2021 fractal. It appears that we are inside the blue oval pull-back which was completed just below the 0.786 Fibonacci level and then bounced for a new High on the -0.5 Fib extension.
See how similar their RSI patterns are as well. As a result, once this pull-back is completed, we expect a rise first to the 87.900 Resistance (top) and the -0.5 Fib above 90.000.
-------------------------------------------------------------------------------
** Please LIKE 👍, SUBSCRIBE ✅, SHARE 🙌 and COMMENT ✍ if you enjoy this idea! Also share your ideas and charts in the comments section below! This is best way to keep it relevant, support me, keep the content here free and allow the idea to reach as many people as possible. **
-------------------------------------------------------------------------------
You may also TELL ME 🙋♀️🙋♂️ in the comments section which symbol you want me to analyze next and on which time-frame. The one with the most posts will be published tomorrow! 👏🎁
-------------------------------------------------------------------------------
👇 👇 👇 👇 👇 👇
💸💸💸💸💸💸
👇 👇 👇 👇 👇 👇
Newzealanddollar
NZD USD - FUNDAMENTAL DRIVERSNZD
FUNDAMENTAL OUTLOOK: NEUTRAL
BASELINE
Over the past 12 months the NZD has been a tricky currency to pin down. Fundamentals that should have provided support haven’t, and the country’s lower terms of trade has made it the biggest loser among the high betas in the cyclical environment. However, over the last few weeks the NZD’s price action has been a lot more promising by responding positively to hawkish RBNZ comments, and bullish to solid CPI and Jobs data. Which means trading NZD has been looking more attractive again. For the week ahead, overall risk sensitivity needs to be kept in mind for the NZD, as well as any further developments regarding the recent rumours and speculation of a potential China reopening.
POSSIBLE BULLISH SURPRISES
Positive Covid developments in China (easing restrictions, more fiscal or monetary stimulus, or letting go of the covidzero policy) could trigger bullish reactions in the NZD. As a risk sensitive currency, and catalyst that causes big bouts of risk on sentiment could trigger bullish reactions in the NZD. Catalyst that triggers recovery in key export commodities (China stimulus, lifting covid restrictions, new infrastructure projects in China) should be supportive for the NZD. Data showing China’s growth outlook is improving or surprise announcement at the CCP congress that Covid-zero will end could provide upside for the NZD.
POSSIBLE BEARISH SURPRISES
Negative Covid developments in China (increasing restrictions or adding additional ones) could trigger bearish reactions in the NZD. As a risk sensitive currency, and catalyst that causes big bouts of risk off sentiment could trigger bearish reactions in the NZD. Catalyst that triggers further weakness in key export commodities (additional China restrictions, demand destruction) could be negative for the NZD. Data showing China’s growth outlook is deteriorating or strong affirmation that the covid-zero policy is here to stay could add additional pressure on the NZD.
BIGGER PICTURE
The bigger picture outlook for the NZD is neutral for now, but that is largely dependent on what happens to China as the New Zealand economy is also very dependent on trade with China and Australia, and also dependent on whether the RNBZ sticks to their hawkish tone or pivots more dovish in the meetings ahead. The currency has been moving more in line with its fundamentals over the past few weeks, which is something that we have not seen for the NZD in the past 12 months. This means opportunities for the NZD is starting to look attractive again. For the week ahead the main highlight will be the US CPI report which can have a big impact across major asset classes. Apart from that, overall risk sentiment and any additional developments on China’s side with regards to potential reopening will be important to watch.
USD
FUNDAMENTAL OUTLOOK: BULLISH
BASELINE
With headline CPI above 8% and Core CPI seeing another acceleration in the SEP CPI data, the Fed is under pressure to continue hiking rates and ramping up QT. At the NOV FOMC presser, Fed Chair Powell shattered any big hopes of a pivot and warned that their SEP expectations for the terminal rate will have to be revised higher. The Fed is on a data-dependent (meeting-by-meeting) policy stance, meaning incoming growth, inflation and jobs data remains a key driver for short-term USD volatility where we expect a cyclical reaction for both the USD and US10Y (good data expected to be supportive for the USD and US yields while bad data is expected to pressure the USD and US yields). The past week was a choppy one for the USD, with upside seen after the more hawkish Fed presser, but a unexpected and punchy move lower after Friday’s mixed NFP jobs report.
POSSIBLE BULLISH SURPRISES
With the Fed signalling a data dependent policy stance, we expect a cyclical reaction from the USD with incoming US data. Thus, extremely good growth, inflation or jobs data is expected to trigger short-term bullish reactions in the USD. If the cyclical outlook continues to weaken, the USD’s safe haven status still matters. Any incoming catalysts that increase deep recession fears and triggers strong moves lower in risk assets & bonds can trigger safe haven flows into the USD. With a lot priced for the Fed and USD, the bar is high for hawkish Fed surprises, but any aggressive Fed speak talking up a >5.5% terminal rate can trigger further USD upside.
POSSIBLE BEARISH SURPRISES
With the Fed signalling a data dependent policy stance, we expect a cyclical reaction from the USD with incoming US data. Thus, extremely bad growth, inflation or jobs data is expected to trigger short-term bearish reactions in the USD. If the cyclical outlook starts to improve, the USD’s safe haven status still matters. Any incoming catalysts that decrease deep recession fears and triggers strong moves higher in risk assets & bonds can trigger safe haven outflows out of the USD. With a lot priced in for the Fed and the USD, it won’t take much to disappoint on the dovish side. Any big concerns about growth from Fed speakers could trigger outflows.
BIGGER PICTURE
The fundamental outlook for the USD remains bullish as long as the Fed stays aggressively hawkish and cyclical concerns put pressure on risk sentiment. The data dependent stance from the Fed means that short-term data surprises can pull the USD either way and would be our preferred way of trading the Dollar right now. The week ahead will give us the most recent US CPI data which will be the biggest focus for markets, and we also have UoM Consumer Sentiment to watch. The price action in the USD following Friday’s NFP was interesting, but not something to use with any real conviction to trade into the week ahead. Waiting for CPI and UoM Consumer Sentiment seems like the safest way to approach the USD in the week ahead.

AUDNZD SHORT STRATEGY We've a downtrend line and the macd is crossing the signal such as ema with the middle bb line

💵British Pound/New Zealand Dollar 💵Analyze (11/03/2022)!!!British Pound/New Zealand Dollar was able to make a Head and Shoulders Pattern near the important trend line.
I expect the British Pound/New Zealand Dollar will go down to the target of the pattern = Support line.
🔅British Pound/New Zealand Dollar Analyze ( GBPNZD ) Time frame 4H⏰.
Do not forget to put Stop loss for your positions (For every position you want to open).
Please follow your strategy, this is just my idea, and I will be glad to see your ideas in this post.
Please do not forget the ✅' like '✅ button 🙏😊 & Share it with your friends; thanks, and Trade safe.

GBPNZD testing support + newsPrice is testing the support for the 4th time, such as MACD.
We can see the columns in MACDS indicator losing power, and the line crossing each other.
About candles we've a three inside up after testing the support, show us a bullish signal.
And to conclude the Reerve Bank of New Zeland says "economy will slow as rising rates curb consumption", the houses prices are still expensive; and this morning in NZ we had data about unemployment and employment, and:
Unemployment: 3,3%, higher thand expected (3,2%). They though the rate was lower than last Q, but is the same as the previous and higher than expected.
Employment: Higher than expected with a change of 1,3bp and the forecast was 0,5%
---------------------------------
Dont forget about yesterday:
BOE made a £838b stimulus and sold £750m of gilts

NZDUSD Broke above the 1D MA50. Trading plan ahead.The NZDUSD pair has been trading within a long-term Bearish Megaphone pattern since the April 05 High. Yesterday it broke (but didn't close) above the 1D MA50 (blue trend-line) for the first time since August 18. Today it is (so far) trading entirely above the 1D MA50. If it closes above it as well, we expect it to extend the rise to the 1D MA100 (green trend-line) where it formed its last Lower High (August 12) at the top of the Bearish Megaphone.
If rejected there or close below the 1D MA50, we will sell and target 0.55700 (top of the October Support Zone). A break above the top of the Bearish Megaphone, would constitute a bullish shift long-term with a first target the 1D MA200 (orange trend-line).
-------------------------------------------------------------------------------
** Please LIKE 👍, SUBSCRIBE ✅, SHARE 🙌 and COMMENT ✍ if you enjoy this idea! Also share your ideas and charts in the comments section below! This is best way to keep it relevant, support me, keep the content here free and allow the idea to reach as many people as possible. **
-------------------------------------------------------------------------------
You may also TELL ME 🙋♀️🙋♂️ in the comments section which symbol you want me to analyze next and on which time-frame. The one with the most posts will be published tomorrow! 👏🎁
-------------------------------------------------------------------------------
👇 👇 👇 👇 👇 👇
💸💸💸💸💸💸
👇 👇 👇 👇 👇 👇

NZDUSD: Very Intriguing Situation
Hey traders,
Take a look what I spotted on NZDUSD pair:
the market is stuck between a recently broken major falling trend line
and a horizontal zone of demand.
I believe that the future direction of the market will be determined by a breakout of one of these structures.
Bullish breakout of a trend line will trigger a strong bullish move,
while a bearish violation of the underlined yellow zone will push the market lower.
Let's patiently wait.
What do you expect?
❤️If you have any questions, please, ask me in the comment section.
Please, support my work with like, thank you!❤️

NZDUSD SHORTSAfter being stopped out yesterday on NU shorts. I have re-entered on the breaker + imbalance area to continue shorts. Price is at premium and looking for discounted price. I will see how it goes to close Friday.

NZDUSD DAILY HELLO GUYS THIS MY IDEA 💡ABOUT NZDUSD is nice to see strong volume area....
Where is lot of contract accumulated..
I thing that the Seller from this area will be defend this SHORT position..
and when the price come back to this area, strong SELLER will be push down the market again..
DOWNTREND + Support from the past + Strong volume area is my mainly reason for this short trade..
IF you like my work please like share and follow thanks
TURTLE TRADER 🐢

NZX to end 2022 with strong headwindsNew Zealand's stock exchange (NZX) could be facing strong headwinds toward the end of 2022 as third-quarter inflation figures suggest an 75-basis-points hike in the central bank's Official Cash Rate (OCR) in November.
In anticipation of the Reserve Bank rate decision earlier in October, the S&P/NZX 50 fell 106.3 points or -1% to 10,959.71. A similar scenario could happen again in the lead up to the November rate decision.
While the index, indeed, recovered following the announcement of the third-quarter inflation figures for the country, it was largely due to strong overnight rally in the US. However, It did not entirely dissipate concerns that a further interest rate hike is fast approaching, potentially adding uncertainty to an already volatile market.
NZX's reaction to rate decisions and inflation figures
Following the announcement of the third-quarter consumer price index for New Zealand, the S&P/NZX 50 index rose 61.4 points or +0.57% to 10,847.34. The strong overnight rally in the US helped offset the reveal of a marginal decline in inflation figure to 7.2% from 7.3%.
The index fell 55.8 points, or -0.51%, to 10,817.23 in the lead up to the announcement of the inflation figure, proving that if not for the strong overnight rally, closing results for the index would have been very different as a still-high inflation number was expected to dampen sentiment and market activity.
The inflation data has elicited expectations for a 75-basis-point hike in the official cash rate when the Reserve Bank of New Zealand makes it monetary policy decision in November. A hike above 50-basis-points is all but guaranteed.
"If interest rates move higher, stock investors become more reluctant to bid up stock prices because the value of future earnings will look less attractive versus bonds that pay more competitive yields today," explained Rob Haworth, senior investment strategy director at U.S. Bank Wealth Management.
"If higher rates are anticipated in the future, the present value of future earnings for stocks are reduced. If this occurs, it may put more pressure on stock prices," he added.
Most sectors emerge as losers when interest rates are increased, except for some exceptions such as the financial sector. As such, the Finance is the NZX’s leading sector for the previous 3 months, racking up gains of +11.34%. Only three other sectors are in positive territory for this time period; Consumer No-Durables (+6.97%), Transportation (+2.74%) and Communications (+1.39%).
What awaits the NZX?
The further rate hike to 4.25% as almost a certainty at this point. At least two Reserve Bank committee members already expressed they are in favor of a 75-point rate increase.
ASB Bank analysts are even expecting the upcoming rate hike to be followed by two more 50-point increases early in 2023 for an expected official cash rate peak 5.25%.
Economists from the Australia and New Zealand Banking Group are joining the consensus for the rate hike in November and adds that a similar decision is anticipated in February 2023. "Both hikes are contingent on global financial markets keeping it together," said ANZ economist Finn Robinson and chief economist Sharon Zollner.

EURNZD: Pullback From Key Level 🇪🇺🇳🇿
EURNZD reached a peculiar confluence zone after the market opening.
I spotted a perfect intersection between a horizontal daily structure support and a minor falling trend line on 1H.
The price perfectly respected that.
I believe the pair will keep growing.
Goals: 1.7238 / 1.7312
❤️If you have any questions, please, ask me in the comment section.
Please, support my work with like, thank you!❤️

AUDNZD: Important Breakout 🇦🇺🇳🇿
Hey traders,
AUDNZD broke and closed below a key daily support this week.
The broken structure turned into a resistance now.
I will expect a bearish continuation to 1.105 level from that.
❤️If you have any questions, please, ask me in the comment section.
Please, support my work with like, thank you!❤️

NZDJPY: Very Bullish Setup 🇳🇿🇯🇵
Hey traders,
NZDJPY was consolidating within a wide horizontal trading range on a daily for 3 weeks.
This week, its resistance was broken with a high momentum bullish candle.
Taking into consideration, that the pair is trading in a long-term bullish trend,
the breakout may push the price higher.
Next resistances: 86.16 / 87.65
❤️If you have any questions, please, ask me in the comment section.
Please, support my work with like, thank you!❤️

GBP NZD - FUNDAMENTAL DRIVERSGBP
FUNDAMENTAL OUTLOOK: WEAK BEARISH
BASELINE
A looming recession has been a key source of Pound weakness and has kept pressure on Sterling despite ongoing BoE hikes. But there is a new threat in focus. It seems the PM’s new fiscal plan, even though putting downside pressure on inflation and lowering growth risks, has drastically increased debt concerns. The disorderly move in Gilt yields were enough to force the BoE’s to step in with a limited (both in time and size) bond buying intervention plan. This has brought some calm to the angst but being limited won’t be enough to fix the fiscal concerns. It was a volatile week for Cable with punchy swings both higher and lower. Between US CPI , bad communication from the BoE and sacking of the Chancellor Sterling struggled for direction. In the week ahead, focus will be on CPI , but after the BoE’s bond intervention program ended on Friday markets will also turn attention to the new Chancellor to see whether he can restore some confidence, or whether he’ll add fuel to the fiscal flames.
POSSIBLE BULLISH SURPRISES
With recession the base assumption, any incoming data that surprises meaningfully higher could trigger relief for the GBP. With focus on stagflation, any downside surprises in CPI or factors that decrease inflation pressures are expected to support the GBP and not pressure it. If massive disorderly moves in Gilts forces the BoE to step up as the buyer of last resorts that could trigger GBP upside. If the new Chancellor can restore confidence and push back more mini-budget elements it could provide upside for GBP.
POSSIBLE BEARISH SURPRISES
With recession the base assumption, any material downside surprises in growth data can still trigger short-term pressure. With focus on stagflation, any upside surprises in CPI or factors that increase more inflation pressures are expected to weigh on the GBP and not support it. If we have big disorderly moves in Gilts but the BoE reiterates, they won’t intervene again that could put pressure on GBP. If the new Chancellor can’t restore confidence and won’t push back on the fiscal plan it could add pressure on Sterling.
BIGGER PICTURE
The fundamentals for Sterling remain bearish . Recession is around the corner (might be in one already), and the new fiscal plan has failed to provide any assurances for investors (even though we think the negative reaction is not completely warranted). As usual there will be a lot of focus on Wednesday’s CPI data, where we still expect a counter-cyclical reaction from Sterling (meaning very high CPI being negative for Sterling while very low CPI prints is expected to be supportive). However, the market’s attention will be firmly fixed on the new Chancellor to see whether he can restore some confidence.
NZD
FUNDAMENTAL OUTLOOK: NEUTRAL
BASELINE
The NZD remains a tricky currency to pin down. Fundamentals that should have provided support over recent months haven’t, and the country’s lower terms of trade has made it the biggest loser among the high betas during recent weeks. The RBNZ stuck to the same script in their meeting this past week, disappointing some who were expecting some caution regarding the longevity of the bank’s current hiking cycle. This was initially supportive for the NZD, but as we’ve seen time and time again the NZD was not able to trade convincingly in line with what its fundamentals suggest. As always risk sensitivity needs to be kept in mind for the NZD, and that means US Q3 earnings season is one to be kept on the radar this incoming week. Any surprise positive or negative announcements from the National Congress of the CCP will be important to watch as well.
POSSIBLE BULLISH SURPRISES
Positive Covid developments in China (easing restrictions, more fiscal or monetary stimulus, or letting go of the covidzero policy) could trigger bullish reactions in the NZD. As a risk sensitive currency, and catalyst that causes big bouts of risk on sentiment could trigger bullish reactions in the NZD. Catalyst that triggers recovery in key export commodities (China stimulus, lifting covid restrictions, new infrastructure projects in China) should be supportive for the NZD. Data showing China’s growth outlook is improving or surprise announcement at the CCP congress that Covid-zero will end could provide upside for the NZD.
POSSIBLE BEARISH SURPRISES
Negative Covid developments in China (increasing restrictions or adding additional ones) could trigger bearish reactions in the NZD. As a risk sensitive currency, and catalyst that causes big bouts of risk off sentiment could trigger bearish reactions in the NZD. Catalyst that triggers further weakness in key export commodities (additional China restrictions, demand destruction) could be negative for the NZD. Data showing China’s growth outlook is deteriorating or strong affirmation that the covid-zero policy is here to stay could add additional pressure on the NZD.
BIGGER PICTURE
The bigger picture outlook for the NZD is neutral for now, but that is largely dependent on what happens to China as the New Zealand economy is also very dependent on trade with China and Australia, and also dependent on whether the RNBZ sticks to their hawkish tone or pivots more dovish in the meetings ahead. Given the currency’s inability to trade in line with any clear fundamental drivers, we’re opting to stay patient with the NZD until further notice.

NZD CAD - FUNDAMENTAL DRIVERSNZD
FUNDAMENTAL OUTLOOK: NEUTRAL
BASELINE
The NZD remains a tricky currency to pin down. Fundamentals that should have provided support over recent months haven’t, and the country’s lower terms of trade has made it the biggest loser among the high betas during recent weeks. The RBNZ stuck to the same script in their meeting this past week, disappointing some who were expecting some caution regarding the longevity of the bank’s current hiking cycle. This was initially supportive for the NZD, but as we’ve seen time and time again the NZD was not able to trade convincingly in line with what its fundamentals suggest. As always risk sensitivity needs to be kept in mind for the NZD, and that means US Q3 earnings season is one to be kept on the radar this incoming week. Any surprise positive or negative announcements from the National Congress of the CCP will be important to watch as well.
POSSIBLE BULLISH SURPRISES
Positive Covid developments in China (easing restrictions, more fiscal or monetary stimulus, or letting go of the covidzero policy) could trigger bullish reactions in the NZD. As a risk sensitive currency, and catalyst that causes big bouts of risk on sentiment could trigger bullish reactions in the NZD. Catalyst that triggers recovery in key export commodities (China stimulus, lifting covid restrictions, new infrastructure projects in China) should be supportive for the NZD. Data showing China’s growth outlook is improving or surprise announcement at the CCP congress that Covid-zero will end could provide upside for the NZD.
POSSIBLE BEARISH SURPRISES
Negative Covid developments in China (increasing restrictions or adding additional ones) could trigger bearish reactions in the NZD. As a risk sensitive currency, and catalyst that causes big bouts of risk off sentiment could trigger bearish reactions in the NZD. Catalyst that triggers further weakness in key export commodities (additional China restrictions, demand destruction) could be negative for the NZD. Data showing China’s growth outlook is deteriorating or strong affirmation that the covid-zero policy is here to stay could add additional pressure on the NZD.
BIGGER PICTURE
The bigger picture outlook for the NZD is neutral for now, but that is largely dependent on what happens to China as the New Zealand economy is also very dependent on trade with China and Australia, and also dependent on whether the RNBZ sticks to their hawkish tone or pivots more dovish in the meetings ahead. Given the currency’s inability to trade in line with any clear fundamental drivers, we’re opting to stay patient with the NZD until further notice.
CAD
FUNDAMENTAL OUTLOOK: NEUTRAL
BASELINE
Recent economic data has shown some deterioration for the growth outlook with three consecutive months of contraction in jobs, falling house prices, and a deceleration in both core and headline CPI. The previous jobs data gave the CAD a decent lift with it’s first jobs gain in four weeks, but at 21K jobs added, the job market is still down 92K jobs in the last four months. Just like the week before, Governor Macklem gave no intention that the bank is getting close to the end of their hiking cycle. Even though he didn’t specifically say that the market’s expectations for the terminal rate is too low, his concerns about inflation saw STIR markets price in close to 88% probability for another 50bsp later this month. That makes the CPI data this upcoming week all the more interesting. Even though inflation is still high, both core and headline 3M annualized CPI saw continued moves lower with the AUG print. Another bigger-than-expected miss will be an interesting one for markets to navigate and could provide some short-term opportunities.
POSSIBLE BULLISH SURPRISES
Catalysts that see upside in Oil (deteriorating supply outlook, ease in demand fears, OPEC developments) could trigger bullish CAD reactions. As a risk sensitive currency, and catalyst that causes big bouts of risk on sentiment could trigger bullish reactions in the CAD. After the bank’s frontloading, there is a very high bar to surprise on the hawkish side for the BoC, but if the bank were to say they think STIR market pricing for the terminal rate is too low that can provide upside for the CAD.
POSSIBLE BEARISH SURPRISES
Catalysts that trigger downside in oil (deteriorating demand outlook, ease in supply shortage, less supply constraints, OPEC developments) could be a negative catalyst for the CAD as well. As a risk sensitive currency, and catalyst that causes big bouts of risk off sentiment could trigger bearish reactions in the CAD. With the bank 100bsp away from terminal rate expectations, and after recent hawkish comments, it won’t take much to surprise dovish, and any signals or comments from the BoC that they’ll pause hikes should be a negative for the CAD.
BIGGER PICTURE
The bigger picture outlook for the CAD remains neutral for now. Given the clear risks to the growth outlook (recent negative econ data and fall in oil prices) we remain cautious on the currency. Furthermore, with lots of good news priced, and with the BoC close to terminal rate expectations, our preferred way of trading the CAD is lower on clear short-term negative catalysts. Biggest focus for the CAD in the week ahead will be the SEP CPI print where a further sign of strong deceleration will be an interesting one to watch, especially after the very recent hawkish BoC comments. Monday’s Business Outlook Survey is also one to watch as the release can cause strong directional flows as well. Apart from that, from a risk sentiment perspective we also need to watch the US Q3 earnings season ramping up this week.

NZDUSD: Waiting For Breakout 🇳🇿🇺🇸
NZDUSD is trading in a bearish trend.
After a strong bearish move, the pair is consolidating for 2 weeks in a horizontal trading range.
I am patiently waiting for its 0.5565 - 0.56 support breakout to short.
We need a daily candle close below that to confirm the breakout.
Next target will be 0.548
❤️If you have any questions, please, ask me in the comment section.
Please, support my work with like, thank you!❤️

NZD USD - FUNDAMENTAL DRIVERSNZD
FUNDAMENTAL OUTLOOK: NEUTRAL
BASELINE
The NZD remains a tricky currency to pin down. Fundamentals that should have provided support over recent months haven’t, and the country’s lower terms of trade has made it the biggest loser among the high betas during recent weeks. The RBNZ stuck to the same script in their meeting this past week, disappointing some who were expecting some caution regarding the longevity of the bank’s current hiking cycle. This was initially supportive for the NZD, but as we’ve seen time and time again the NZD was not able to trade convincingly in line with what its fundamentals suggest. As always risk sensitivity needs to be kept in mind for the NZD, and that means US CPI and the start of Q3 earnings season (both catalysts that can trigger decent reactions in risk sentiment) needs to be kept on the radar this incoming week.
POSSIBLE BULLISH SURPRISES
Positive Covid developments in China (easing restrictions, more fiscal or monetary stimulus, or letting go of the covidzero policy) could trigger bullish reactions in the NZD. As a risk sensitive currency, and catalyst that causes big bouts of risk on sentiment could trigger bullish reactions in the NZD. Catalyst that triggers recovery in key export commodities (China stimulus, lifting covid restrictions, new infrastructure projects in China) should be supportive for the NZD.
POSSIBLE BEARISH SURPRISES
Negative Covid developments in China (increasing restrictions or adding additional ones) could trigger bearish reactions in the NZD. As a risk sensitive currency, and catalyst that causes big bouts of risk off sentiment could trigger bearish reactions in the NZD. Catalyst that triggers further weakness in key export commodities (additional China restrictions, demand destruction) could be negative for the NZD.
BIGGER PICTURE
The bigger picture outlook for the NZD is neutral for now, but that is largely dependent on what happens to China as the New Zealand economy is also very dependent on trade with China and Australia, and also dependent on whether the RNBZ sticks to their hawkish tone or pivots more dovish in the meetings ahead. Given the currency’s inability to trade in line with any clear fundamental drivers, we’re opting to stay patient with the NZD until further notice.
USD
FUNDAMENTAL OUTLOOK: BULLISH
BASELINE
With headline CPI above 8% and Core CPI seeing acceleration in August, the Fed is under pressure to continue hiking rates and ramping up QT. The bank made its third 75bsp at the Sep meeting and pushed up their 2023 terminal rate projection to 4.6%. The Fed is on a data-dependent (meeting-by-meeting) policy stance, meaning incoming growth, inflation and jobs data remains a key driver for short-term USD volatility where we expect a cyclical reaction with incoming data for both the USD and US10Y (good data expected to be supportive for the USD while bad data is expected to pressure the USD). It was a choppy week for the USD, with entertaining ‘Fed Pivot’ narratives trying to make sense of the price action. In the week ahead, all eyes turns to the week’s main event which is Thursday’s September US CPI report.
POSSIBLE BULLISH SURPRISES
With the Fed signalling a data dependent policy stance, we expect a cyclical reaction from the USD with incoming US data. Thus, extremely good growth, inflation or jobs data is expected to trigger short-term bullish reactions in the USD. If the cyclical outlook continues to weaken, the USD’s safe haven status still matters. Any incoming catalysts that increase deep recession fears and triggers strong moves lower in risk assets & bonds can trigger safe haven flows into the USD. With a lot priced in for the Fed and the USD, the bar is high for hawkish Fed surprises, but any aggressive Fed speak talking up a higher than 5% terminal rate can trigger further USD upside.
POSSIBLE BEARISH SURPRISES
With the Fed signalling a data dependent policy stance, we expect a cyclical reaction from the USD with incoming US data. Thus, extremely bad growth, inflation or jobs data is expected to trigger short-term bearish reactions in the USD. If the cyclical outlook starts to improve, the USD’s safe haven status still matters. Any incoming catalysts that decrease deep recession fears and triggers strong moves higher in risk assets & bonds can trigger safe haven outflows out of the USD. With a lot priced in for the Fed and the USD, it won’t take much to disappoint on the dovish side. Any big concerns about growth from Fed speakers could trigger outflows.
BIGGER PICTURE
The fundamental outlook for the USD remains bullish as long as the Fed stays hawkish and cyclical concerns put pressure on risk sentiment. The data dependent stance from the Fed means that short-term data surprises can pull the USD either way and would be our preferred way of trading the Dollar right now. In the upcoming week markets will only have eyes for one data point and that will be the US September CPI data released on Thursday. With expectations of a higher Core CPI YY but expectations of a lower Headline CPI YY it seems risky to trade into this event.

AUDJPYPrice went down with an impulse towards the third touch of our lower trendline and accumulated, we expect a continuation to the sell side

NZD-USD Will Keep Falling! Sell!
Hello,Traders!
NZD-USD is trading in a downtrend
And the pair has formed a bearish flag pattern
So we are bearish biased on the pair
And after the breakout
A further move down
Is to be expected
Sell!
Like, comment and subscribe to boost your trading!
See other ideas below too!

Today’s Notable Sentiment ShiftsNZD – The New Zealand dollar perked up on Wednesday after the RBNZ raised interest rates as expected and doubled down on its resolve to contain runaway inflation.
Commenting on the meeting, Westpac noted: “The consideration of a 75 by move – given it could reduce the risk of a higher peak in the overall OCR cycle – suggests the RBNZ is now eyeing a considerably higher peak than the 4.1% from its August projections… We recently revised up our OCR forecast to a peak of 4.5% by next February.”
