NFLX WEEKLY OPTIONS TRADE (07/28/2025)**🎬 NFLX WEEKLY OPTIONS TRADE (07/28/2025) 🎬**
**Institutions Are Buying Calls – Should You?**
---
📈 **Momentum Breakdown:**
* **Daily RSI:** Mixed ➡️ Possible short-term weakness
* **Weekly RSI:** Bullish bias intact ✅
🔥 Overall = **Moderate Bullish** trend confirmed on the **weekly timeframe**
📊 **Options Flow:**
* **Call/Put Ratio:** **2.23** 🚨
💼 Strong institutional call flow = **bullish bias** from big money
* **Strike Ideas from Models:**
* \$1260 (Grok/xAI)
* \$1230 (Gemini/Google)
* \$1220 (Meta)
* ✅ **\$1200** (Consensus Strike)
🧨 **Volume Warning:**
* 📉 Institutional participation is **lower than average**
* 🚫 Could signal weak follow-through or fading interest
---
🧠 **AI Model Consensus (Grok / Gemini / Claude / Meta / DeepSeek):**
✅ Call buying favored across the board
✅ Weekly bullish momentum confirmed
⚠️ Daily RSI & low volume = headwinds
📌 Play it smart: momentum’s real, but conviction isn’t maxed
---
💥 **RECOMMENDED TRADE (65% Confidence):**
🎯 **Play:** Buy CALL Option
* **Strike:** \$1200
* **Expiry:** 2025-08-01
* **Entry:** \~\$8.50
* **Profit Target:** \$16.00 → \$17.00
* **Stop Loss:** \$5.10
📆 Entry Timing: Monday market open
📏 Position Size: Risk-managed (2-4% portfolio)
---
⚠️ **RISK CHECKLIST:**
* 🟡 **Volume Fragility:** Institutions not fully loading
* 🟥 **Gamma Risk:** Expiry this week = possible sharp swings
* 🔴 **Daily RSI Divergence:** Short-term weakness still possible
---
📌 **TRADE DETAILS (JSON Format for Automation):**
```json
{
"instrument": "NFLX",
"direction": "call",
"strike": 1200.0,
"expiry": "2025-08-01",
"confidence": 0.65,
"profit_target": 16.00,
"stop_loss": 5.10,
"size": 1,
"entry_price": 8.50,
"entry_timing": "open",
"signal_publish_time": "2025-08-01 09:30:00 UTC-04:00"
}
```
---
**TL;DR:**
🟢 Weekly bullish setup with strong options flow
🟡 Daily weakness = proceed with discipline
🎯 \ NASDAQ:NFLX \$1200C for short-term momentum upside
💬 Are you following the institutions or fading the low volume?
\#NFLX #OptionsFlow #AITrading #WeeklySetup #InstitutionalMoney #TechStocks #UnusualOptionsActivity #TradingView #MomentumTrading
NFLX

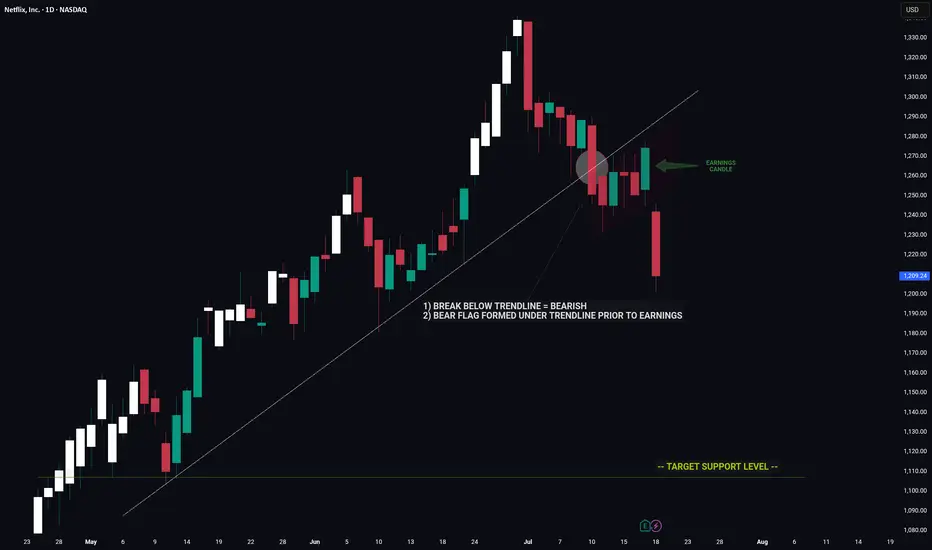
NETFLIX -- Price Signaled A Move Lower Prior To EarningsHello Traders!
The chart of NFLX is a great example of using clues to decipher a future move.
Prior to earnings we had major bearish indicators on the chart that hinted towards a move down on earnings.
1) Break below major trendline
2) Bear flag
These two signals by themselves are very bearish however the fact that these signals appeared coming into earnings was an even strong indicator of a potential for negative move.
Now that the upward trend is broken NFLX has a long way to fall before reaching the next key support level.
Thanks everyone and best of luck on your trading journey!
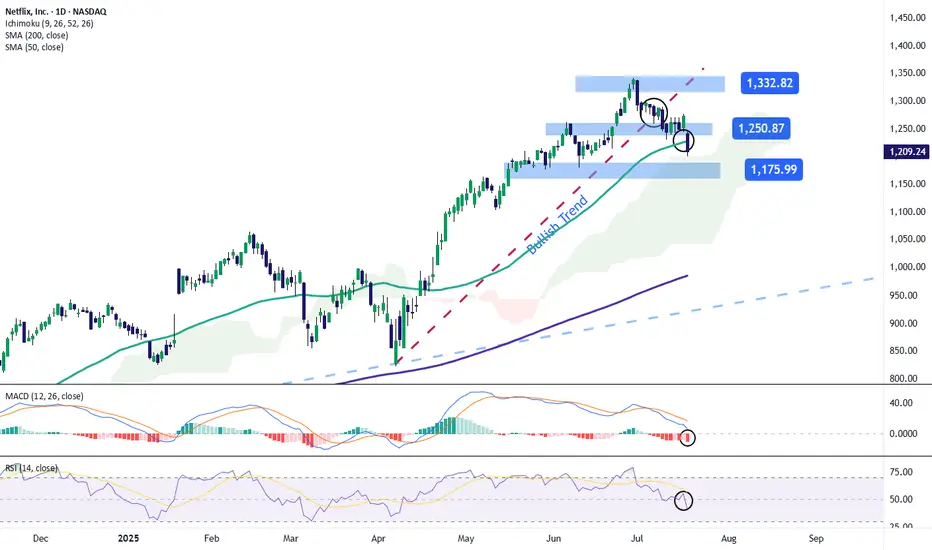
Netflix Stock Drops After Earnings ReleaseShortly after publishing its financial results, Netflix posted a decline of over 5% toward the end of the week and continues to show a strong bearish bias. This comes despite reporting a positive earnings per share (EPS) figure of $7.19, beating the expected $7.08, and revenue of $11.08 billion, slightly above the forecast of $11.07 billion.
However, in its post-earnings communications, the company stated that it expects very moderate growth for the remainder of the year. It also warned that the positive indicators could begin to compress due to increased spending on marketing and content, which has ultimately weakened the impact of the solid financial results. As a result, the stock faced persistent selling pressure heading into the weekly close.
Uptrend Breaks
Over the past few weeks, starting in early April, the stock had followed a steady uptrend, pushing the price above $1,300. However, continued bearish corrections have now brought the price down to the $1,200 area, causing a clear break in the previous uptrend. This breakdown could further strengthen the bearish pressure in the coming sessions if the negative sentiment persists.
MACD
The MACD histogram continues to move below the zero line, and as it drifts further from this level, it signals a steady bearish momentum that could remain dominant in the near term if the trend continues.
RSI
The RSI line has broken sharply below the neutral 50 level, indicating a clear dominance of bearish momentum in the market. As long as it does not reach oversold territory, this move may suggest a continued increase in short-term selling pressure.
Key Levels:
1,332 – Recent High: This is the most important resistance level. If price action returns to this area, it could reactivate the previous uptrend, which had been weakening on the chart.
1,250 – Nearby Resistance: A barrier defined by the most recent neutral zone. It may act as a temporary ceiling against short-term bullish corrections.
1,175 – Key Support: A critical level located below the 50-period simple moving average. If the price breaks below this level, it could strengthen a bearish bias and trigger a more consistent downtrend.
Written by Julian Pineda, CFA – Market Analyst
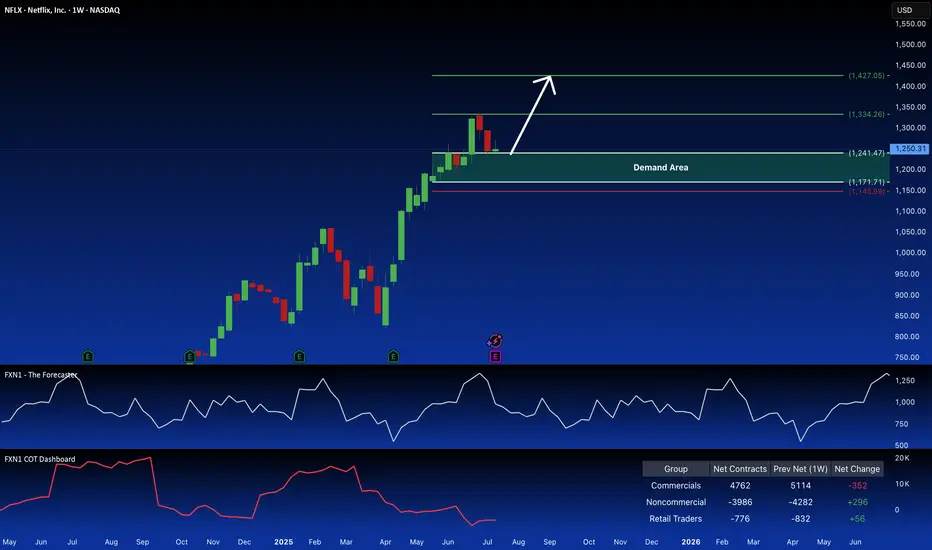
NFLX: Bullish Signal in Demand ZoneNetflix (NFLX) recently retraced within a key weekly demand zone, potentially presenting a long opportunity. Non-commercial traders are also accumulating long positions in the stock. This suggests a possible bullish setup. Your thoughts?
✅ Please share your thoughts about NFLX in the comments section below and HIT LIKE if you appreciate my analysis. Don't forget to FOLLOW ME; you will help us a lot with this small contribution.
How Earnings Reporting Could Impact Netflix (NFLX) Share PriceHow Earnings Reporting Could Impact Netflix (NFLX) Share Price
Earnings season is gaining momentum. Today, after the close of the main trading session, Netflix (NFLX) is set to release its quarterly financial results.
Analysts are optimistic, forecasting earnings per share (EPS) of $7.08, up from $4.88 a year earlier, and revenue growth to $11.1 billion.
The upbeat sentiment is driven by:
→ the fact that Netflix’s business model is relatively resilient to tariff-related pressures;
→ the company’s success in curbing password sharing and promoting a more affordable ad-supported subscription tier.
Netflix has reported revenue growth for six consecutive quarters, outperforming competitors such as Disney, Amazon, and Apple. Its market share has climbed to 8.3%, with YouTube remaining its only serious rival—YouTube's share increased from 9.9% a year ago to 12.8% in June, according to Nielsen. If current trends hold, this reporting quarter could mark another strong performance for Netflix.
However, is the outlook truly that bullish?
Technical analysis of NFLX stock chart
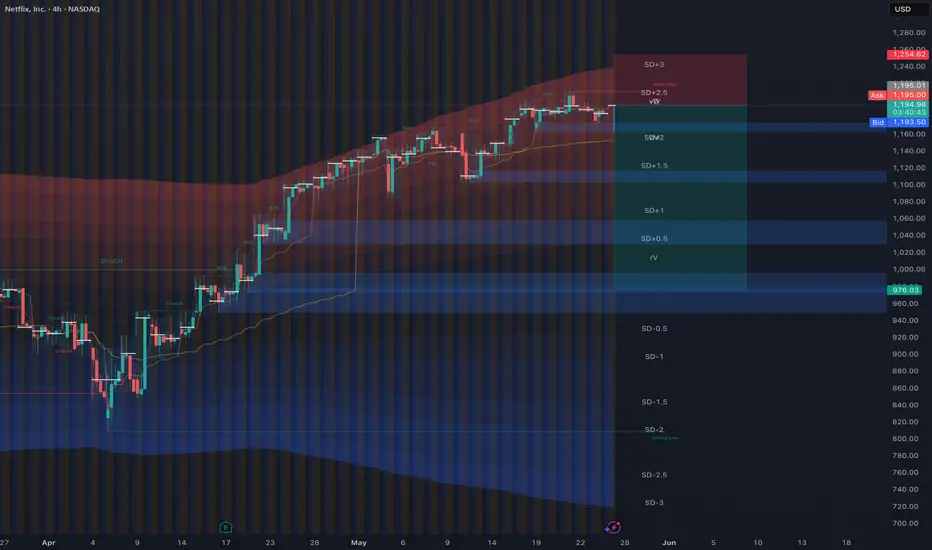
The NFLX stock price is currently moving within an ascending channel (marked in blue), and it is now testing the lower boundary of this formation. Of concern is the recent pronounced bearish movement (B), which has dragged the stock from the channel’s upper boundary to its lower edge—erasing the bullish momentum (A) that followed the breakout above the $1,250 resistance level.
What’s next?
→ On the one hand, bulls may attempt to resume the upward trend within the channel.
→ On the other hand, bears could build on their recent momentum (highlighted in red) and break the ascending trend that has been in place since May.
It appears the fate of the current uptrend hinges on the market’s reaction to today’s earnings release.
This article represents the opinion of the Companies operating under the FXOpen brand only. It is not to be construed as an offer, solicitation, or recommendation with respect to products and services provided by the Companies operating under the FXOpen brand, nor is it to be considered financial advice.
Netflix: Hovering Just Below Key Target ZoneNetflix has rebounded over the past two sessions after falling below the beige Short Target Zone ($1,270–$1,432) and is now trading just beneath it. A renewed push into this range could complete turquoise wave 3, followed by a corrective wave 4 likely dipping below $1,180. Alternatively, with a 33% probability, turquoise wave alt.3 may already have peaked, opening the door for an immediate drop through $1,180. A broader correction in beige wave IV is expected once wave III concludes, before upside resumes in wave V.
📈 Over 190 precise analyses, clear entry points, and defined Target Zones - that's what we do (for more: look to the right).

NFLX Netflix Options Ahead of EarningsIf you haven`t bought NFLX before the previous earnings:
Now analyzing the options chain and the chart patterns of NFLX Netflix prior to the earnings report this week,
I would consider purchasing the 1260usd strike price Puts with
an expiration date of 2025-9-19,
for a premium of approximately $71.10.
If these options prove to be profitable prior to the earnings release, I would sell at least half of them.
Disclosure: I am part of Trade Nation's Influencer program and receive a monthly fee for using their TradingView charts in my analysis.
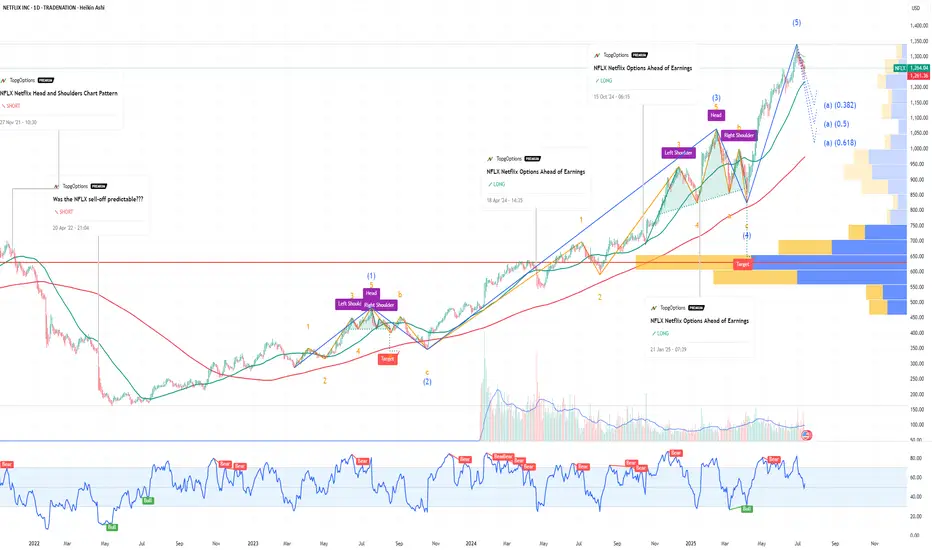
NFLX CRACK!!Classic breakdown move from a rising F flag!
Massive Head and shoulders formed, that head test followed through, taking out stops, and now failing off the top of the channel.
Screaming CAUTION to the bulls!
Nice simple short setup for bears.
Click boost, follow, and subscribe. Let's get to 5,000 followers. ))


AAAPL: Updated Outlook and Best Level to BUY/HOLD 70% gains________________________________________
Apple Outlook: July 2025–Q1 2026
After peaking near $200 in late May, Apple (AAPL) remains under correction territory despite pockets of resilience, closing July around $193. The current correction is projected to persist until Q1 2026, as global macro and policy headwinds weigh on the broader tech sector. Technicals suggest AAPL could find its cycle low between Q3 and Q4 2025, potentially setting the stage for a renewed bull run into late 2026. Pullback until 170/175 USD. 📉
Catalysts Shaping Apple’s Stock Price in 2025–26
1. AI Integration and Apple Intelligence
Strength: 9/10
The roll-out of on-device Apple Intelligence features—including an upgraded Siri, ChatGPT integrations, and generative AI tools—continues to build anticipation for a major iPhone upgrade supercycle. Initial adoption has been strong, but broader impact will hinge on Q4 developer and enterprise feedback. 🤖
2. Services Segment Growth
Strength: 8.5/10
Apple’s Services business (App Store, iCloud, Apple Music, AI-powered subscriptions) is projected to post double-digit growth into Q4 2025, with consensus revenue estimates at $25–27B for the quarter. Analysts see upside from new AI-driven service bundles, which could add $5–8B in annualized revenue by 2026. 💡
3. Gross Margin Expansion & Cost Efficiencies
Strength: 8/10
Apple’s gross margin is forecast to improve by up to 60 basis points in Q4 2025 as the product mix tilts toward higher-margin services, and as component costs ease. Operational efficiencies from supply-chain automation may further cushion profit margins amid macro uncertainty. 📊
4. iPhone 17 Product Cycle
Strength: 7.5/10
The iPhone 17 lineup—rumored to include advanced polymer batteries and potential foldable form factors—is expected to launch Q4 2025, giving Apple a competitive hardware edge versus Android rivals. Early channel checks point to pent-up demand, though upgrade rates may lag previous cycles due to consumer caution. 📱
5. Vision Pro & Hardware Diversification
Strength: 7/10
Next-gen Vision Pro headsets and new AR/VR devices, boosted by Apple Intelligence, are expected to drive incremental growth in Q4 2025. However, high price points and limited mainstream adoption keep near-term impact contained. 🥽
6. Share Buybacks & Dividend Policy
Strength: 7/10
Apple’s $110B share buyback authorization and steady dividend growth provide valuation support, but recent market volatility has prompted a more cautious pace of repurchases. Yield-seeking investors are watching closely for any pivot in capital return policy if macro pressures persist. 💵
7. Supply Chain & Trade Policy Risks
Strength: 6.5/10
Escalating U.S.–China trade tensions—including the risk of expanded tariffs or tech export bans—remain a top concern. Apple is accelerating its assembly shift toward India and Vietnam to diversify risk, but any new policy shocks in Q4 could hit margins and unit volumes. 🌏
8. Regulatory & Antitrust Pressures
Strength: 6/10
The EU’s Digital Markets Act and potential U.S. antitrust probes could force Apple to further open up its iOS ecosystem by year-end, potentially capping Services revenue growth and adding compliance costs. ⚖️
9. Macro & Interest-Rate Environment
Strength: 5/10
With the Fed signaling “higher for longer” rates through mid-2026, tech sector valuations remain under pressure. Analysts see this limiting multiple expansion even if EPS growth resumes in late 2025. 📈
10. Smartphone Market Competition
Strength: 5/10
Aggressive pricing and innovation from Samsung and Chinese OEMs are intensifying competitive pressures, especially in emerging markets. Apple’s share gains are likely to slow until the macro environment improves and new hardware cycles fully materialize. 🥊
________________________________________
Analyst Projections for Q4 2025:
• Consensus Revenue: $108–112B (up ~4% YoY)
• EPS Estimate: $2.30–$2.42
• Gross Margin: 45–46%
• iPhone Unit Growth: 2–3%
• Services Revenue: $25–27B
Morgan Stanley and JP Morgan maintain “Overweight” ratings, but expect rangebound performance until macro and trade uncertainty clears. Most price targets for Q4 2025 hover between $195–$215, with upside potential post-correction into 2026. 📊
________________________________________
Analyst / Firm Date Rating Price Target (USD)
Barclays 06/24/2025 – 173 ()
Jefferies (E. Lee) 07/01/2025 Hold (Upgraded) 188.32
UBS (D. Vogt) 07/03/2025 – 210.00
J.P. Morgan (S. Chatterjee) 06/26/2025 Overweight 230.00
Morgan Stanley (E. Woodring) 03/12/2025 Overweight 252.00
Evercore ISI 01/31/2025 – 260.00
Redburn Partners 01/31/2025 – 230.00
D.A. Davidson (G. Luria) 05/02/2025 – 250.00
TradingView Consensus (avg) – Consensus 228.98
TipRanks Consensus (avg over 3mo) – Consensus 226.36

NFLX She got away #3Ahh yes the 3rd stock/idea/position I sold out of in order to go all in on $TSLA. I will stay the course with my plan, but when it hits I'm going to Diversify. You should only make mistakes once, if you repeat them you should cut your left nut. IDK, just have a real consequence so you don't F up again.
Currently it's overextended and needs a correction to 1100-1000....but what happens if they announce a stock split? oh yeah, this could moon..... again. fml

Profit taking on Netflix for the summer, only to buy in lowerNASDAQ:NFLX is still in a strong high time frame uptrend, I'm not saying the stock has turned bearish overall, however profits need to be taken when trading and this is one of those times.
I'd prefer to buy back in closer to $1,000 if possible though either way I'll keep 33% of my stack.

The party is almost over for Netflix Netflix is in an area of resistance. As you can see , the trendlines with multiple points are intersecting in this area. The bearish divergence on the Rsi , coupled with the confluence of resistance and extreme valuation, lends credence to a very profitable short here.

NFLX Weekly Options Outlook — June 1, 2025🚨 Multi-Model Summary
This week’s analysis from top AI models (Grok, Claude, Llama, Gemini, DeepSeek) shows moderate bullish momentum for NASDAQ:NFLX , with a range of technical insights and trade strategies.
🧠 Model Highlights
Grok (xAI)
🔹 Technicals: Price above 10EMA, nearing overbought.
🔹 Sentiment: Bullish news (BofA), VIX low.
🔹 Trade: Buy $1290C @ $0.94 → PT $1.41 / SL $0.47
🔹 Confidence: 60%
Claude (Anthropic)
🔹 Technicals: Strong EMAs, bullish MACD on 5M.
🔹 Sentiment: BofA upgrade + options flow into $1300.
🔹 Trade: Buy $1220C @ $12.25 → PT $18–20 / SL $8
🔹 Confidence: 72%
Llama (Meta)
🔹 Technicals: Bullish near-term; RSI normalized.
🔹 Sentiment: BofA bullish note, minor CNBC drag.
🔹 Trade: Buy $1290C @ $0.94 → PT $2.50 / SL $0.40
🔹 Confidence: 65%
Gemini (Google)
🔹 Technicals: Uptrend, MACD divergence noted.
🔹 Sentiment: Strong BofA note, watch $1180 max pain.
🔹 Trade: Buy $1250C @ $4.40 → PT $6.60 / SL $2.20
🔹 Confidence: 60%
DeepSeek
🔻 Bearish Divergence
🔹 Technicals: Overextended short-term.
🔹 Sentiment: Max pain + put skew → downside risk.
🔹 Trade: Buy $1100P @ $0.71 → PT $1.77 / SL $0.35
🔹 Confidence: 65%
✅ Consensus Takeaways
🟢 4 out of 5 models lean bullish
📊 Price > EMAs, sentiment tailwind (BofA upgrade)
⚠️ Max pain at $1180 could act as late-week magnet
⚡ Risk-on setup but overbought—watch for short pullbacks
🎯 Chosen Trade Setup
💡 Trade Idea: Buy NFLX $1220C (2025-06-06)
💵 Entry: $12.25
🎯 Target: $18.40 (+50%)
🛑 Stop: $7.96 (−35%)
🔢 Size: 1 contract
🧠 Confidence: 70%
⏰ Entry: At open (Monday)
⚠️ Key Risks to Watch
RSI near overbought → potential pause
Max pain gravity at $1180 into Friday
Late-week gamma decay = faster premium loss
Macro news or earnings surprises may shift bias
📊 TRADE DETAILS (JSON)
json
Copy
Edit
{
"instrument": "NFLX",
"direction": "call",
"strike": 1220.0,
"expiry": "2025-06-06",
"confidence": 0.70,
"profit_target": 18.40,
"stop_loss": 7.96,
"size": 1,
"entry_price": 12.25,
"entry_timing": "open",
"signal_publish_time": "2025-06-01 16:24:59 EDT"
}

Netflix is gearing up for an epic fallNetflix is sitting in the apex of a very large rising wedge. The rally is stalling here with a larger macro backdrop that may cause some selling pressure. If it breaks down from the rising wedge, we might witness some intense selling. The RSI is showing bearish divergence on multiple time frames. My target is circa $900.

NFLX is looking nastyPositive sentiment at ATH, nobody even dares shorting it, all while being extremely overbought and consumers short on expendable income. I've seen this before.
NFA. TP and SL are not accurate, I just used the short position tool to show direction. I'm in position with 1100p looking to TP around 1065 and 980.
Netflix - The bulls just never stop!Netflix - NASDAQ:NFLX - is insanely bullish now:
(click chart above to see the in depth analysis👆🏻)
The entire stock market basically collapsed during April. Meanwhile, Netflix is creating new all time highs with a +20% parabolic bullish candle. Looking at the chart, this strength is very likely to continue even more until Netflix will (again) retest the upper resistance trendline.
Levels to watch: $1.400
Keep your long term vision!
Philip (BasicTrading)

NFLX Great Long Term but Risky Shorter Term NASDAQ:NFLX
Looks riskier shorter term due to confluence resistance, but not impossible to see larger breakout here.
Longer term (2027-2028) $5,000 price target.

Netflix (NFLX) Share Price Reaches Record HighNetflix (NFLX) Share Price Reaches Record High
According to the charts, Netflix (NFLX) shares have risen above $1,170 – the highest level in the company’s history. Since the start of 2025, the price of NFLX stock has increased by approximately 33%, while the S&P 500 index (US SPX 500 mini on FXOpen) remains close to its opening levels from 2 January.
Why Is Netflix (NFLX) Performing Strongly?
A month ago, we highlighted several factors contributing to NFLX’s outperformance relative to the broader stock market. Among them is the fact that Netflix does not offer tradable goods subject to tariffs in trade wars. As a result, the company could potentially benefit from an economic downturn if consumers spend more time at home.
According to recent reports:
→ Netflix has announced that 94 million subscribers are now using its low-cost ad-supported plan – a figure more than a third higher than the 70 million reported in November.
→ The company also forecasts that advertising revenue will double this year.
Technical Analysis of the NFLX Share Chart
The share price continues to move within the upward channel (shown in blue) we identified previously. At the same time:
→ the price is currently near the upper boundary of this channel, which has repeatedly acted as resistance (as indicated by arrows);
→ the RSI indicator shows a potential bearish divergence.
Under these conditions, a corrective move in Netflix’s stock price cannot be ruled out – for example, towards line Q or the channel median.
This article represents the opinion of the Companies operating under the FXOpen brand only. It is not to be construed as an offer, solicitation, or recommendation with respect to products and services provided by the Companies operating under the FXOpen brand, nor is it to be considered financial advice.

NFLX Head Test Cracking!Head test Cracking! Now we get to see what it's made of.
Head tests patterns take out stops before collapsing.
I was forced into "target reached" by TV. Clearly, my target has not been reached since the H&S never broke to trigger a trade to begin with.
This is a much better setup with very low risk, with potentially huge returns for shorts. A lot of meat on that bone!!
Click boost, follow, subscribe! For more tips, tricks, and calls. Let's get to 5,000 followers and help more people navigate these crazy markets.

NFLX Bearish Setup!This is a simple setup that almost anyone can read—a Head & Shoulders at the top signaling a reversal pattern.
Contrary to popular belief H&S are continuation patterns if they are not at a top.
The only other time H&S are reversal patterns is if the chart has multiple H&S everywhere.
Time for bulls to take their money and RUN!!! The fun ride is over for a while. Time to go home. ((
CAUTION!
Click BOOST, follow subscribe. Let me help you navigate these crazy markets. ))

Break and retest setup on NFLX soon? OptionsMastery:
🔉Sound on!🔉
📣Make sure to watch fullscreen!📣
Thank you as always for watching my videos. I hope that you learned something very educational! Please feel free to like, share, and comment on this post. Remember only risk what you are willing to lose. Trading is very risky but it can change your life!

Netflix Skyrockets After Q1 Revenue Surge: What’s Next?📺 NASDAQ:NFLX has recently exhibited a strong bullish trend, supported by both technical breakout structure and positive fundamental developments. After an extended rally from the March lows, the stock managed to break above a key resistance zone between $1,080 and $1,100, it has now been decisively cleared. With this breakout, the structure confirms bullish momentum, and the expectation is for a retest of this newly formed support area before resuming the uptrend.
The price is currently around $1,133, and a pullback into the $1,060–$1,080 zone would present a high-probability buy opportunity. This aligns with classic price action behavior: after a breakout, markets often retrace to test former resistance, now turned support. If we see it retest, it would validate the technical setup for a continuation move toward the projected target of $1,220.
🌟From a fundamental perspective, the recent Q1 earnings report (released on April 17, 2025) added strong fuel to the upside momentum. Netflix reported $10.54 billion in revenue for the quarter, exceeding Wall Street’s expectations and representing a 13% year-over-year growth. Net income also impressed, coming in at $2.9 billion. Perhaps more telling than the earnings themselves was Netflix’s decision to stop reporting quarterly subscriber numbers. This shift in focus toward profitability and revenue per user signals confidence in their monetization model and emphasizes a transition to a more mature phase of growth. Management’s tone on the earnings call adds to all this, citing growing traction in its ad-supported tier and plans to expand into live sports and podcast-style content.
💰Technically, the overall structure remains bullish. The breakout is clean, and volume is supportive. The area above $1,140 has low volume resistance, which means price can move relatively easily toward the next psychological barrier at $1,220. Any deeper pullback that breaches below $1,020 would invalidate the short-term bullish bias, as it would signal a failure to hold above former resistance and could mean the start of a deeper correction toward the trendline support from last October.
🚀 In conclusion, the current market behavior suggests Netflix is in the process of forming a bullish continuation, supported by a clean breakout above prior resistance, robust financial performance, and an optimistic revenue outlook.
Price is likely to retest the breakout zone, offering a potential long setup anticipating a move higher if momentum remains strong. The technical picture is backed by future growth plans, making Netflix a stock to watch closely in the coming weeks for confirmation of the pullback and continuation.
